
If I want a board to act, I can’t lead with CVSS scores. I need to show loss in dollars, hours of downtime, and what stops in patient care.
Here’s the short version:
- The article says healthcare cyber risk should be framed around cost, outage length, and care impact
- It uses figures like $7.42 million per incident, $1.5 million to $2.5 million in weekly ransomware loss, and up to $1.7 million per hour for a medium hospital EHR outage
- It points to three core methods: FAIR, ALE, and scenario-based modeling
- It covers both internal systems like EHR, PACS, and LIS, and third-party risk such as vendor PHI breaches and service outages
- It says boards should track business results like canceled procedures, diversion hours, claims backlog, overtime, time to safe minimum service, and time to full restoration
- It ends with a board dashboard built on expected annual loss, outage cost, per-record breach cost, remediation cost, vendor dependence, and exposure versus risk appetite
What I take from it is simple: technical severity does not help directors choose where to spend. Dollar ranges and disruption ranges do. A breach of 50,000 records at $398 per record points to about $19.9 million before outage loss is added. A vendor breach affecting 100,000 records points to about $39.8 million before legal, regulator, and brand costs.
A short view of the article’s main points:
| Focus area | What the board needs to see |
|---|---|
| Financial loss | Incident cost, annual loss range, breach cost by record count |
| Downtime | Cost per hour, outage length, restoration timeline |
| Patient care impact | Canceled cases, diverted patients, paper workflow time, backlog |
| Third-party risk | Vendor outage exposure, PHI breach exposure, workflow dependence |
| Funding choices | Control cost versus loss reduction |
So if I were briefing a board, I’d keep it plain: What could happen? What would it cost? How long would care and revenue be disrupted? What spend lowers that loss the most?
That is the article’s core message, stripped down to what a reader needs first.
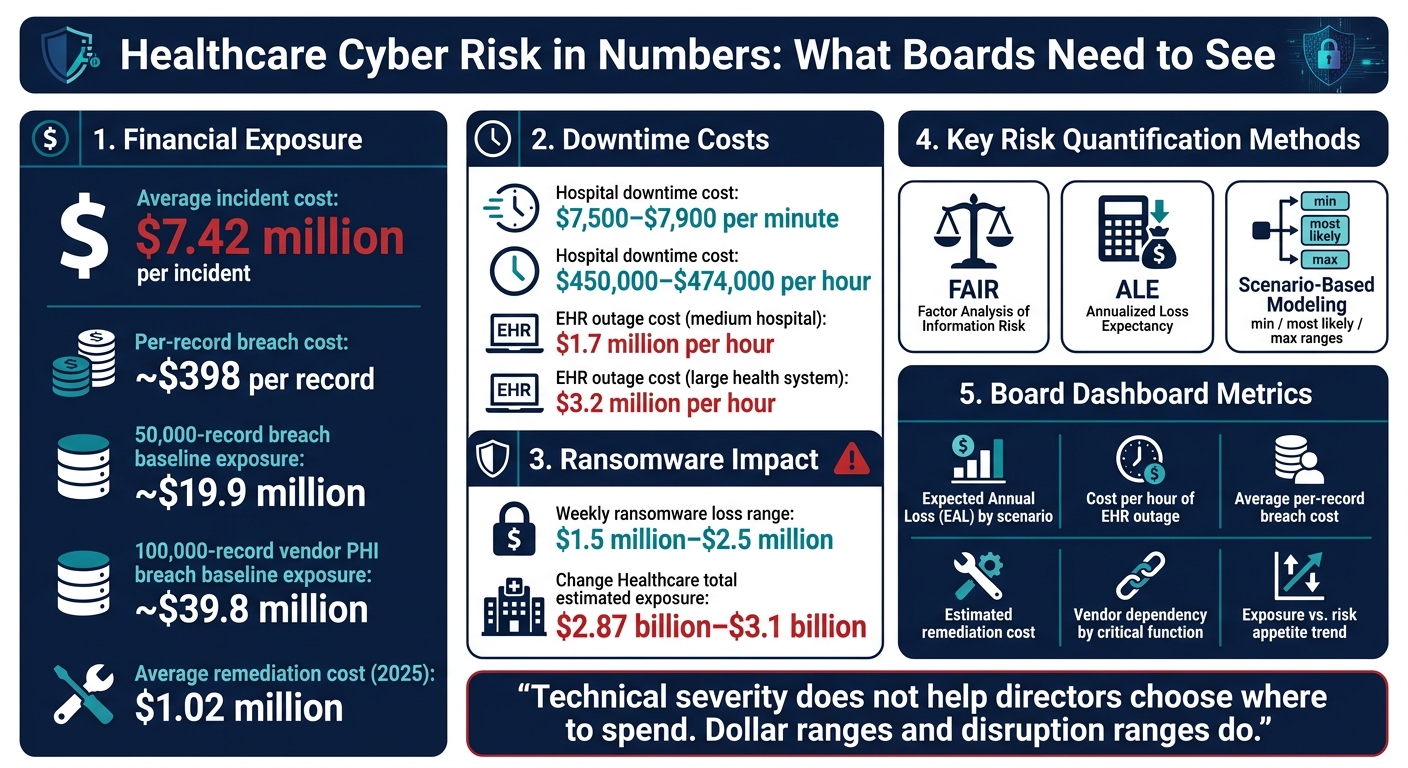
Healthcare Cyber Risk in Numbers: What Boards Need to See
Build a Quantification Model the Board Can Use
Start with Common Risk Language and Healthcare Asset Mapping
Start with plain, shared risk terms. If people use different words for the same problem, board discussions get muddy fast.
Then map each critical asset to the service and revenue stream it supports. An EHR supports clinical documentation and revenue cycle work. A PACS outage can delay radiology reads and care decisions. The same goes for LIS platforms, revenue tools, and critical vendors.
Once each asset is tied to a specific service or revenue stream, the board can see what’s on the line if that system goes down. That map becomes the starting point for each loss scenario.
Apply FAIR, Annualized Loss Expectancy, and Scenario Analysis
FAIR (Factor Analysis of Information Risk) puts cyber scenarios into dollar terms. It estimates event frequency and loss magnitude, which gives leaders a financial way to compare risk against tolerance.
Annualized Loss Expectancy (ALE) estimates expected annual loss for a defined scenario and compares that figure with the cost and estimated effect of proposed controls. FAIR and ALE also work alongside NIST SP 800-30 and NIST Cybersecurity Framework 2.0 by adding a monetary view to the assessment process.
Use ranges instead of single-point estimates. For any scenario, whether it’s ransomware or an EHR outage, model a minimum, most likely, and maximum loss. A medium hospital facing an EHR outage might lose $1.7 million per hour at the most likely estimate, while a large health system could hit $3.2 million per hour [1]. Ranges show uncertainty without pretending the math is exact. Those estimates then feed the board report and the investment case.
Use Censinet RiskOps to Organize and Report Quantified Risk Data
For these scenarios to stay useful over time, the underlying data has to stay current and organized. Censinet RiskOps™ centralizes risk registers plus third-party and enterprise risk assessments, giving the board one quantified view of risk in dollars, downtime, and business impact.
Censinet AI™ drafts evidence summaries for review and approval, then routes key findings to the right stakeholders. That helps keep board reporting steady for funding decisions.
sbb-itb-535baee
Translate Cyber Events Into Financial Exposure
Estimate Breach Costs by Category
Break cyber loss into four buckets: direct response, legal and regulatory, reputational, and downstream operational costs. The first wave usually hits fast. That means forensic work, system restoration, and overtime pay to keep things running.
Then the next set of costs starts to show up: legal bills, regulator scrutiny, brand damage, and downstream losses like interrupted procedures, diverted patients, and delayed claims.
Use ranges instead of a single number. At $398 per record, a breach involving 50,000 records points to about $19.9 million in baseline exposure before you even factor in operational disruption [1].
And that’s often only the first loss. The second one is usually bigger: downtime. Organizations can mitigate these risks by following steps to prevent ransomware attacks.
Model Downtime Costs from Ransomware and System Outages
Downtime is where financial exposure climbs fast, and it’s also where many boards miss the mark on cost. Hospital downtime is estimated at $7,500 to $7,900 per minute, or about $450,000 to $474,000 per hour [1]. During a full EHR outage, losses can reach $1.7 million per hour for a medium hospital and $3.2 million per hour for a large health system [1].
Here’s what that looks like in practice: a ransomware attack forces a mid-sized hospital to take its EHR offline. Admissions slow down. Staff go back to paper workflows. Documentation backs up. Claims stop moving. At the medium-hospital rate, that outage can cost up to $1.7 million per hour [1].
In 2025, Kettering Health underwent a full restoration of its Epic EHR system following a ransomware attack to regain administrative and clinical functionality [1].
Keep business interruption separate from recovery spend. They’re tied together, but they’re not the same thing.
Quantify Third-Party Breach and Outage Scenarios
Vendor incidents follow the same math, but the impact spreads further. If a third party that holds your patients' protected health information (PHI) gets breached or goes down, your organization may still face legal costs, regulator action, and damage to its name.
The 2024 Change Healthcare ransomware incident shows how this plays out at scale. Healthcare delivery organizations that relied on Change Healthcare for claims processing dealt with their own revenue cycle disruption, cash flow shortfalls, and manual workarounds. Those costs didn’t show up in the vendor’s totals, but providers still had to absorb them [1]. UnitedHealth Group's total estimated financial exposure reached between $2.87 billion and $3.1 billion [1].
For a board-ready third-party scenario, set a few plain assumptions up front:
- Number of records exposed
- Length of the outage
- Number of affected sites
- Which clinical or revenue workflows are disrupted
A vendor PHI breach affecting 100,000 records at $398 per record implies about $39.8 million in baseline exposure before legal, regulatory, and reputational losses are added [1]. And if a hosted service outage hits multiple sites and key workflows, losses can stack up fast.
That’s how vendor risk moves from a color-coded heat map to a dollar figure leaders can act on.
Dollar exposure tells one part of the story; the next step is measuring how those losses disrupt care delivery.
Measure Operational Disruption and Patient Care Impact
Track Resilience Metrics Tied to Care Delivery
After dollars, boards need to see what cyber risk does to care delivery. Money matters, but it’s only part of the story. Boards also need a clear view of operational impact.
That means tracking measures like canceled procedures, diversion hours, overtime, claims backlog, and time to restore core systems. Those numbers help with board reporting and shape investment decisions.
Two measures matter a lot here: time to safe minimum operations and time to full restoration. The distance between those two points shows where the organization is exposed. That’s the stretch where care teams are still working, but not at full strength.
Map Cyber Dependencies Across Clinical Workflows and Devices
Those recovery gaps don’t stay on a dashboard. They show up fast in broken workflows across clinical areas and devices.
Every clinical area depends on systems that can fail. Boards need to understand how outages in the ED, OR, ICU, oncology, and cardiology interrupt care and slow decision-making. The same goes for the systems and services behind them, including:
- Medical devices
- Imaging
- Pharmacy
- Lab
- Third-party services
When those systems go down, staff often switch to paper workflows just to keep documentation and orders moving. In May 2024, Ascension shifted to paper workflows after a ransomware attack disrupted digital systems [1] - slowing documentation, orders, and handoffs across care teams.
Express Disruption as Board-Ready Business Consequences
Clinical disruption needs to be translated into terms boards recognize: canceled procedures, diverted patients, delayed claims, longer restoration times, and overtime costs.
A short ransomware outage can lead to weekly losses of $1.5 million to $2.5 million [1]. That figure can include overtime, backlog cleanup, and patient diversion. Put those measures next to breach-cost estimates and downtime models, and the board gets a fuller view of the damage - both the cost to fix the incident and the cost of keeping care moving during recovery.
Boards need one view of cyber risk that ties together likelihood, downtime, and financial impact.
These measures then feed directly into board dashboards and investment decisions.
Turn Quantified Risk Into Board Reporting and Investment Decisions
Design a Board Dashboard with Dollars, Downtime, and Top Scenarios
A board dashboard should answer three plain-English questions: what could go wrong, what would it cost, and is exposure getting better or worse.
That means moving past abstract scores and showing numbers a board can use. The goal isn't to drown directors in detail. It's to give them a clean view of loss, disruption, and where action matters most.
Use these core metrics:
| Metric Category | Dashboard Metric | Healthcare Benchmark / Context |
|---|---|---|
| Financial Exposure | Expected Annual Loss (EAL) by scenario | Average incident cost: $7.42M [1] |
| Downtime Risk | Cost per hour of EHR outage | $1.7M (medium hospital) to $3.2M (large health system) [1] |
| Data Risk | Average per-record breach cost | ~$398 per record [1] |
| Recovery Cost | Estimated remediation bill | 2025 average: just over $1.02M [1] |
| Third-Party Concentration | Vendor dependency by critical function | Share of critical workflows dependent on top vendors |
| Trend Indicator | Exposure vs. risk appetite over time | Below, within, or above risk appetite |
Each scenario should appear as a range, not a single number. That's a big deal. A board can respond to a dollar band. A raw risk score, on the other hand, doesn't tell them what to fund, what to watch, or what to change.
Rank scenarios by loss size, then map which controls cut exposure the most. That helps the board see where money will do the most work, fast.
Use Quantified Reporting to Support Funding Decisions
Once risk has a dollar value, the budget discussion changes. It stops being a vague request to "improve security posture" and turns into a direct choice between controls.
A CISO can walk into the room with a specific case - for example, a ransomware-driven EHR outage - show the estimated annual loss range, then line that up against a proposed control, its cost, and the drop in expected loss.
Put it plainly for the board: spend $X, reduce expected loss by $Y.
That side-by-side view matters because it ties funding to likelihood, cost, and loss reduction at the same time. It's much easier to approve spending when leaders can see the tradeoff in dollars instead of guesswork.
Conclusion: The Numbers That Help Boards Prioritize Cyber Resilience
Boards can't govern what they can't measure. The move from technical severity scores to dollars, downtime, and disruption metrics is what makes cyber risk readable at the leadership level.
Healthcare cybersecurity leaders who quantify breach costs, model EHR outage exposure, measure patient care disruption, and account for third-party risk give boards something they can act on. When those numbers connect to investment choices and are tracked over time in a clear dashboard, cyber resilience becomes a governance issue the board can fund, monitor, and assign ownership to.
Closing the Gap: Monetary Quantification of Cybersecurity for the Board
FAQs
How do we start quantifying cyber risk in dollars?
Start with a financial method like FAIR to estimate how often an event may happen and how much it could cost. That means looking beyond the first hit and pricing in downtime, recovery labor, legal costs, and reputational damage.
Then map your key clinical and operational dependencies to the assets and vendors behind them. From there, model scenarios such as an EHR outage or a third-party breach across three stages:
- Immediate response
- Business disruption
- Long-term consequences
Use baseline data to tie those estimates to specific controls and show ROI.
Which board metrics matter most during a cyber incident?
Boards care about metrics that connect technical problems to business impact: financial exposure, operational disruption, and clinical impact.
That means looking at measures like estimated financial loss, downtime tied to lost revenue and service interruptions, patient encounters affected, diverted patients, patient safety-related incidents, and response performance such as MTTD, MTTR, and containment time.
How should we measure third-party cyber risk exposure?
Measure third-party cyber risk in terms the board can act on: money and business impact.
That means putting numbers on what a breach could cost, including system downtime, regulatory fines, and legal fees. Instead of leaning only on static heat maps, use FAIR to estimate how often a loss event is likely to happen and how large that loss could be.
Track a small set of KPIs to keep the picture clear:
- percentage of critical vendors assessed
- aging of open high-risk findings
- time since the last reassessment
Add these metrics to your risk register so leaders get a clearer, dollar-based view of third-party risk.
Related Blog Posts
- From Undervalued to Indispensable: How to Elevate ERM in Board-Level Discussions
- “How to Talk to Your Board About Cyber Risk - And Actually Get Funding”
- Benchmark Reveals Cyber Events Carry Higher Financial Burden than Natural Disasters for Hospitals
- Benchmarking Study Finds Cyber Risk Governance Emerging as Board-Level Priority
