
If your cyber KPIs don’t lead to action, they’re just dashboard noise. I’d keep this simple: pick a small set of 10–15 KPIs, tie each one to patient safety, PHI protection, or care continuity, give every metric one owner, and define clear formulas, targets, and review dates.
In healthcare, that matters fast. In 2024, OCR received 663 large breach reports, and 67% of healthcare organizations reported ransomware hits, with mean recovery costs of $2.57 million. Add in an average breach cost of $9.77 million, and it’s clear why loose reporting isn’t enough.
Here’s the short version of what I’d take from this checklist:
- Use both control KPIs and risk indicators
- Keep the KPI set small and tied to top risk areas
- Track six main domains:
- vulnerability and patching
- identity and access
- detection and response
- backup and recovery
- medical device security
- third-party risk
- Define each KPI with:
- a formula
- a target
- a data source
- a reporting cadence
- one accountable owner
- Show leaders only what helps them decide where risk is high and whether it is moving up or down
A few metrics stand out because they connect straight to care delivery and cyber risk:
- Critical patch compliance
- MFA adoption
- MTTD and MTTR
- Backup restore success
- Medical device inventory coverage
- Vendor assessment coverage
- BAA coverage for PHI vendors
Cybersecurity Metrics & KPIs CISOs Use To Prove Value
sbb-itb-535baee
Quick comparison
| KPI area | What to measure | Example target |
|---|---|---|
| Patching | Critical systems patched within SLA | ≥ 95% |
| Identity | MFA on workforce and privileged accounts | ≥ 98% workforce; 100% privileged |
| Detection | Time to detect high-severity incidents | < 4 hours |
| Recovery | Restore test success for Tier-1 clinical systems | ≥ 95% |
| Medical devices | High-risk devices on isolated segments | ≥ 90%–95% |
| Vendors | Current assessments for in-scope vendors | ≥ 90%–95% |
The main idea is simple: I’d only keep KPIs that show whether cyber risk to clinical systems, PHI, and vendor reliance is going down - and I’d report them in plain language leaders can act on.
Checklist: Set KPI Design Rules Before Choosing Metrics
Before you pick metrics, set the rules first. That keeps the program tied to what matters most in healthcare: patient safety, PHI protection, care continuity, and cyber resilience.
Keep the program tight. Aim for 8–12 core KPIs so reports stay focused on the highest-risk areas instead of turning into a long list no one uses [11][13]. Any new KPI should come with a written reason for why it belongs. It also helps to assign a fixed number of KPIs to each main domain:
- Vulnerability and patching
- Identity and access
- Detection and response
- Backup and recovery
- Medical device security
- Third-party risk
From there, connect each KPI to a clear healthcare risk priority.
Map KPIs to Healthcare Risk Priorities
Every KPI should be tagged to at least one healthcare priority. Start with your top risks: patient safety, clinical and EHR uptime, ransomware resilience, medical device security, third-party oversight, and regulatory or audit readiness. Then match each risk to the metrics that show whether things are getting better or worse.
For ransomware resilience, useful KPIs include patch SLA attainment, privileged activity anomalies, and ransomware recovery time. For reducing downtime, track backup recoverability along with MTTD and MTTR for incidents that affect clinical systems. For third-party oversight, metrics such as vendor risk assessment completion rate and time to remediate critical vendor findings show supply chain exposure in a direct way.
Use both leading indicators and lagging indicators. Leading indicators can include MFA adoption and restore success. Lagging indicators can include breach detection time and unplanned downtime [3][6][7][8][9].
Once each KPI is linked to a priority, the next step is to make sure everyone defines and reports it the same way.
Standardize Definitions, Targets, and Reporting Cadence
After mapping KPIs to priorities, document each one in full. Every metric should have a standard definition sheet with six parts: KPI name and description, data source, calculation method, target threshold, owner, and reporting frequency [3][2][8].
The calculation method matters more than many teams think. Write it as a formula, not a loose note. For example: Patch compliance rate = (patched devices within SLA ÷ in-scope devices) × 100. Or: Phishing susceptibility rate = (users who clicked the simulation ÷ users who received it) × 100% [3][6]. A vague line like we track patching won’t stand up in an audit and won’t help you compare one month to the next.
Targets should be numeric and tied to your risk appetite. For example: ≥ 95% patch compliance on critical clinical systems or MTTD ≤ 4 hours for high-severity alerts [3][5]. When you're reporting to executive teams, it can help to translate high-risk gaps into dollar impact so the business side sees what the issue means in plain terms [5].
For reporting cadence, line it up with your current governance cycle. Pick one reporting period format across all reports, such as monthly or quarterly [3][4].
These rules help weed out weak metrics before they ever land on the dashboard.
Good vs. Poor KPI Comparison Table
The table below shows the difference between KPIs that help decision-making and ones that just take up space. Use it to review your current metrics before locking in your KPI set.
| Dimension | Good KPI | Poor KPI |
|---|---|---|
| Clarity | Patch compliance rate on critical clinical servers (patched within SLA ÷ in-scope devices × 100) | Patching status with no formula or scope |
| Quantifiability | Backup recoverability = successful restore tests ÷ tests attempted × 100, for Tier-1 applications | We test backups regularly |
| Actionability | Phishing susceptibility rate and reporting rate by department - directly shows where training or controls need strengthening | Number of emails blocked |
| Healthcare relevance | Number of medical devices with unresolved safety recalls; unplanned vs. planned device downtime | Generic IT uptime with no connection to patient care |
| Board readability | Ransomware recovery time; third-party risk assessment coverage rate presented with clinical impact context | Raw IDS alert count with no business translation |
If a KPI keeps failing these checks, rework it or retire it before it gets dashboard space.
Checklist: Track Core Cybersecurity KPIs
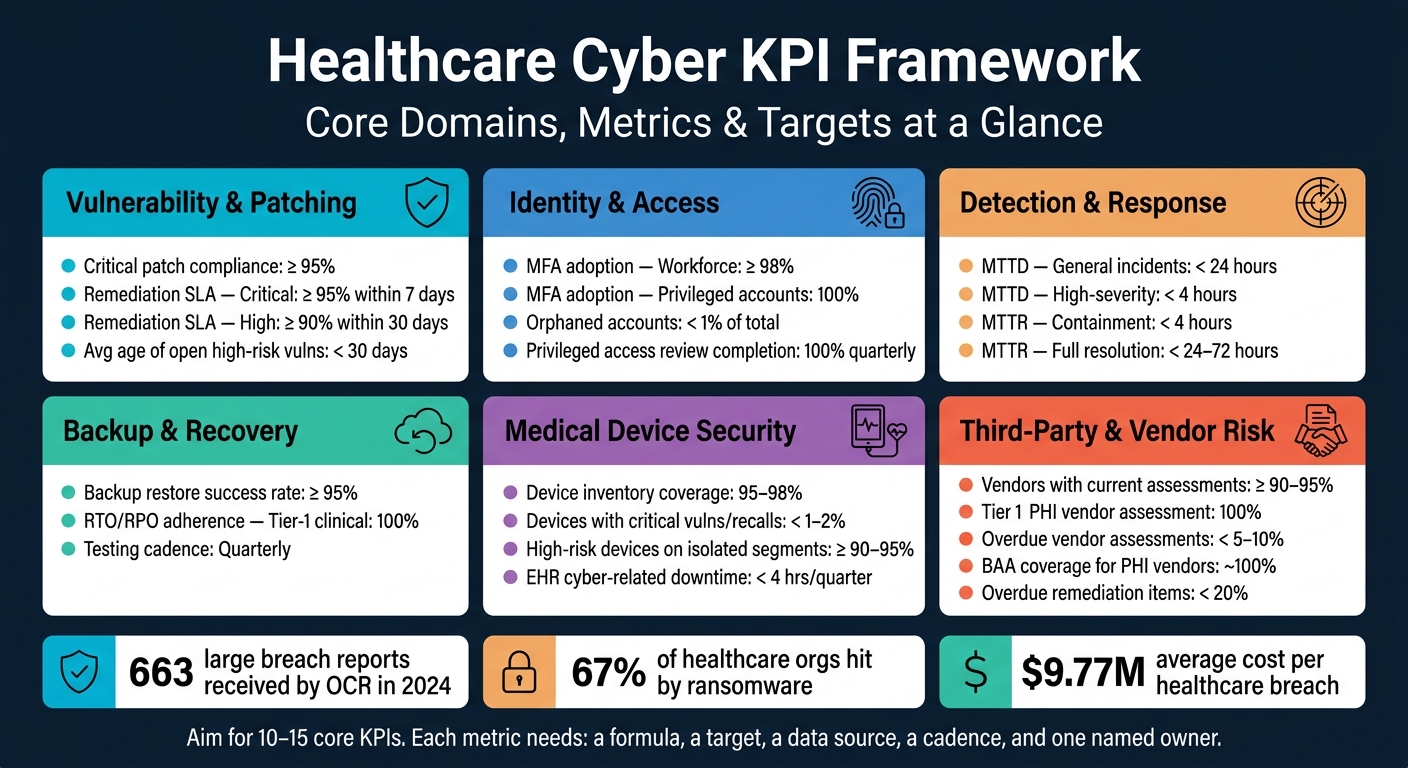
Healthcare Cyber KPI Framework: Core Domains, Metrics & Targets
Once your KPI rules are in place, pick a small set of operational metrics that shows whether risk is actually going down. Keep the list tight. Focus on metrics your team can already pull from tools you use today, like your EDR, SIEM, vulnerability scanner, IAM platform, and backup software.
Start with exposure and patching. In most cases, that’s where you’ll see the fastest drop in risk.
Vulnerability, Patching, and Exposure Management
These metrics show whether critical clinical systems are staying exposed for too long.
Start with critical patch compliance rate. This is the percentage of in-scope assets - internet-facing servers, EHR systems, PACS, and core network infrastructure - that are running current patches for critical vulnerabilities. Calculate it as (patched assets ÷ total in-scope assets) × 100. Set the target based on your baseline, with ≥ 95% as the end-state for critical internet-facing and EHR systems.
Pair that with remediation SLA attainment by severity. Track the percentage of vulnerabilities closed within your policy windows. For example:
- Critical findings within 7 calendar days
- High findings within 30 days
- Medium findings within 60 days
Report this monthly, and break out exceptions by age: 30, 60, and 90 days [1]. Also track the count and average age of open high-risk vulnerabilities across internet-facing systems and key clinical applications [14]. If the average age is over 30 days, remediation is falling behind.
After patching and exposure, shift to access control and account hygiene.
Identity, Detection, Response, and Recovery
These metrics help protect EHR access, email, and remote work accounts.
Track three identity KPIs. MFA adoption rate should target ≥ 98% of workforce accounts and 100% of privileged accounts for remote access, EHR, and email. Orphaned account count - accounts with no active HR record or valid vendor contract - should move toward less than 1% of total accounts, reconciled monthly. Privileged access review completion rate shows whether scheduled quarterly reviews are finishing on time. Target 100% completion, with exceptions escalated to management.
Then measure how fast your team detects, contains, and recovers from incidents. Time to detect should aim for under 24 hours for general incidents and under 4 hours for high-severity alerts [12]. Mean Time to Recover (MTTR) should target containment under 4 hours and full resolution within 24–72 hours, depending on incident class [12].
For resilience, track backup restore success rate. Calculate it as successful restore tests ÷ tests attempted for Tier-1 clinical systems. Target ≥ 95%, and test quarterly. This keeps the metric tied to care continuity, not just general IT recovery. This alignment is critical for taking the risk out of healthcare operations.
KPI Definition Table by Security Domain
| Domain | KPI | Unit | Suggested Target | Reporting Cadence |
|---|---|---|---|---|
| Vulnerability & Patching | Critical patch compliance rate | % | ≥ 95% (internet-facing & EHR systems) | Monthly |
| Vulnerability & Patching | Remediation SLA attainment - critical | % | ≥ 95% closed within 7 days | Monthly |
| Vulnerability & Patching | Remediation SLA attainment - high | % | ≥ 90% closed within 30 days | Monthly |
| Vulnerability & Patching | Age of open high-risk vulnerabilities | Days (avg & max) | Avg < 30 days; max < 90 days | Monthly (weekly for high-risk systems) |
| Identity & Access | MFA adoption rate | % | ≥ 98% workforce; 100% privileged accounts | Monthly |
| Identity & Access | Orphaned account count | Count & % of total accounts | < 1% of total accounts | Monthly |
| Identity & Access | Privileged access review completion | % | 100% of scheduled quarterly reviews | Quarterly |
| Detection & Response | Mean Time to Detect (MTTD) | Hours | < 24 hrs general; < 4 hrs high-severity | Monthly |
| Detection & Recovery | Mean Time to Recover (MTTR) | Hours | Containment < 4 hrs; resolution < 24–72 hrs | Monthly |
| Backup & Recovery | Backup restore success rate | % | ≥ 95% successful restore tests within recovery time objective (RTO) | Quarterly |
| Backup & Recovery | RTO/RPO adherence | % of incidents meeting targets | 100% for Tier-1 clinical systems | Per incident + annual DR exercise |
If your team is starting from scratch, baseline each metric before setting targets. Get a clear picture of current performance first, then tighten targets as your program gets better.
Use these as your core operational KPIs before adding device and vendor metrics. Next, extend the KPI set to medical devices and vendor risk management.
Checklist: Measure Healthcare-Specific and Third-Party Cyber Risk
Healthcare risk KPIs can't stop at core IT. They also need to cover medical devices, clinical systems, and outside vendors. The operational KPIs above give you the baseline. These metrics focus on the parts of healthcare that can affect care delivery and vendor reliance.
Medical Device and Clinical System KPIs
Start with inventory. If you don't know what devices are on the network, it's hard to manage risk in any serious way.
Track the percentage of network-connected medical devices in a validated inventory: (devices in validated inventory ÷ total network-connected devices) × 100. A good target is 95%–98%, with validation done quarterly against CMMS and clinical engineering records. [16][19][20]
Next, track the percentage of devices with critical vulnerabilities or open recalls. Mature programs should aim for below 1%–2%. If devices sit above that line, the next step is simple: remediate, isolate, or retire them. [16]
It also helps to pair that with a segmentation coverage KPI: (high-risk devices on isolated network segments ÷ total high-risk devices) × 100. The goal is ≥90%–95% of life-critical and high-risk devices on documented isolated network segments.
For clinical systems, track cyber-related downtime for EHR, PACS, and eMAR as separate measures, in hours per quarter. For the EHR, keep the target under 4 hours per quarter because downtime there hits care delivery and patient safety directly. [15][17][18]
Third-Party and Vendor Risk KPIs
Vendors often handle PHI and support mission-critical services, so they need to sit inside the KPI set, not outside it. If supplier issues can disrupt clinical uptime, vendor risk has to be tracked with the same discipline as internal controls.
Use the table below to track vendor risk with clear formulas and mature targets. [20][21]
| KPI | Formula | Mature Target |
|---|---|---|
| Vendors with current assessments | Assessed within defined interval ÷ total in-scope vendors × 100% | ≥ 90–95% (100% for Tier 1 PHI vendors) |
| Overdue vendor assessments | Vendors past reassessment due date ÷ total in-scope vendors × 100% | < 5–10% |
| Overdue remediation items | Open tasks past agreed due dates ÷ total remediation tasks × 100% | < 20% |
| BAA coverage for PHI vendors | Vendors with executed BAAs ÷ vendors that create, receive, maintain, or transmit PHI × 100% | Near 100%; exceptions time-limited |
| High/critical residual risk vendors | Count and % of vendors rated high or critical residual risk | Declining quarter-over-quarter |
Residual risk trends can tell you a lot, fast. A stronger posture usually means assessment coverage is going up, overdue rates are going down, and the share of high-risk vendors is getting smaller. A weaker posture looks different: larger backlogs and a stubbornly high count of high/critical residual risk vendors, especially those handling PHI or supporting mission-critical clinical operations.
Use Benchmarking and Risk Visualization to Strengthen KPI Programs
Use internal trends and peer benchmarking to spot outliers, set targets, and prioritize remediation. Internal benchmarking - looking across hospitals, ambulatory sites, and service lines - can show where teams are short on time, tools, or staffing. Censinet RiskOps™ supports cybersecurity benchmarking and unified risk visualization across HDO and vendor assessments.
For executives and Boards, present the data in a form they can scan quickly. Heat maps by clinical domain and vendor tier help show where risk sits. Trend charts make movement over time easy to see. Portfolio risk distributions show how many vendors fall into each risk category. In practice, executive dashboards should include heat maps, trend charts, and vendor-tier views.
Conclusion: Build a KPI Set Leaders Can Act On
With the KPI rules and domain metrics in place, the last step is making the set usable for leaders. A useful cyber risk KPI set should start with three priorities: patient safety, PHI protection, and clinical continuity. Every KPI should tie straight to one of those priorities across vulnerability, identity, response, recovery, devices, and vendors. If a metric doesn’t connect to one of those areas, it probably shouldn’t be on the dashboard.
Keep the set tight. Aim for 10 to 15 core metrics. That’s enough to cover the main risk areas without turning the dashboard into a wall of noise. Give each metric a named owner, set a weekly, monthly, or quarterly reporting cadence based on the audience, and define thresholds that trigger action instead of passive review. A KPI with no owner and no escalation path is just a number.
Once the core set is in place, keep it current as risk shifts. Review it at least once a year, or sooner after incidents, acquisitions, or major technology changes. New deployments and device growth can change the risk picture fast, so the KPI set needs to move with it.
What to Include on Executive and Board Dashboards
Those metrics should roll up into a board view that shows only the risks leaders need to make decisions on. Board and executive dashboards should answer one question fast: Where is risk high, and is it getting better or worse? The most useful categories are critical vulnerability exposure, incident response speed, recovery readiness, medical device risk, third-party assessment coverage, open high risks, and compliance remediation status.[22][23]
For each metric, show:
- current value
- target threshold
- trend direction
- owner
A one-page, color-coded view usually works well for boards. Leaders should also see estimated financial exposure. In healthcare, the average cost is $9.77 million per breach.[10] Pair that with a short narrative that explains what changed since last quarter and what decisions are needed now. Clear numbers, trends, and plain language turn the dashboard into a decision tool.
Censinet RiskOps™ can support this executive and operational reporting with concise risk scores for leaders and detailed assessment data for operational teams.
FAQs
How do I choose the right cyber KPIs?
Choose a small set of KPIs that ties straight to your main goals, like patient safety, PHI protection, and clinical continuity. Keep each KPI SMART: Specific, Measurable, Achievable, Relevant, and Time-bound.
Focus on metrics that actually shape decisions or change behavior. Give each KPI a clear owner, use past data to set realistic thresholds, and map your KPIs to recognized frameworks like NIST CSF 2.0.
What should I do if I lack baseline data?
If you don’t have baseline data yet, skip static benchmarks. They can look neat on paper, but they often miss what matters in practice.
A better path is to set thresholds through governance based on the clinical and operational impact of each system. And if a tool can affect patient safety, use tighter criteria from the start.
Use recognized standards like the NIST AI Risk Management Framework as your starting point. Bring in clinical experts early, then run an initial risk assessment to spot gaps and set your first benchmarks.
How often should healthcare cyber KPIs be reviewed?
Review frequency should line up with how critical the system is and how fast new risks can show up. A patient-safety-critical tool may need near-real-time or hourly monitoring. An administrative system, on the other hand, may only need a weekly or monthly review.
A cross-functional governance committee should review KPI performance every quarter. Alert quality should also be checked every 3 to 6 months. After major system changes, re-baseline for 30 to 90 days. Vendor compliance should be reviewed monthly, with audits scheduled based on the vendor's risk level.
