
Your internal view may say one thing, but your internet-facing posture may say another. I’d sum this up in plain terms: if I want a more honest view of cyber risk, I have to look at what the network shows, compare it with peers, and rank the gaps that sit below the sector baseline.
Here’s the short version:
- Asset management and supply chain security challenges are still weak across healthcare, at 53% and 52% coverage.
- Known vulnerability mitigation sits at 74%, so about 1 in 4 organizations is still below baseline.
- Email protections are stronger at 86%, but phishing risk does not go away.
- Medical device security risks is still low at 48%.
- Healthcare scores higher in Respond (85%) than in Govern and Identify (64%), which shows many teams are better at reaction than at finding and reducing exposure early.
What that means for me is simple: I should treat internet-facing services, patch timing, email controls, and vendor links as hard signals of risk, not side notes. If peers have fixed a gap and I still show it, that gap moves up the list.
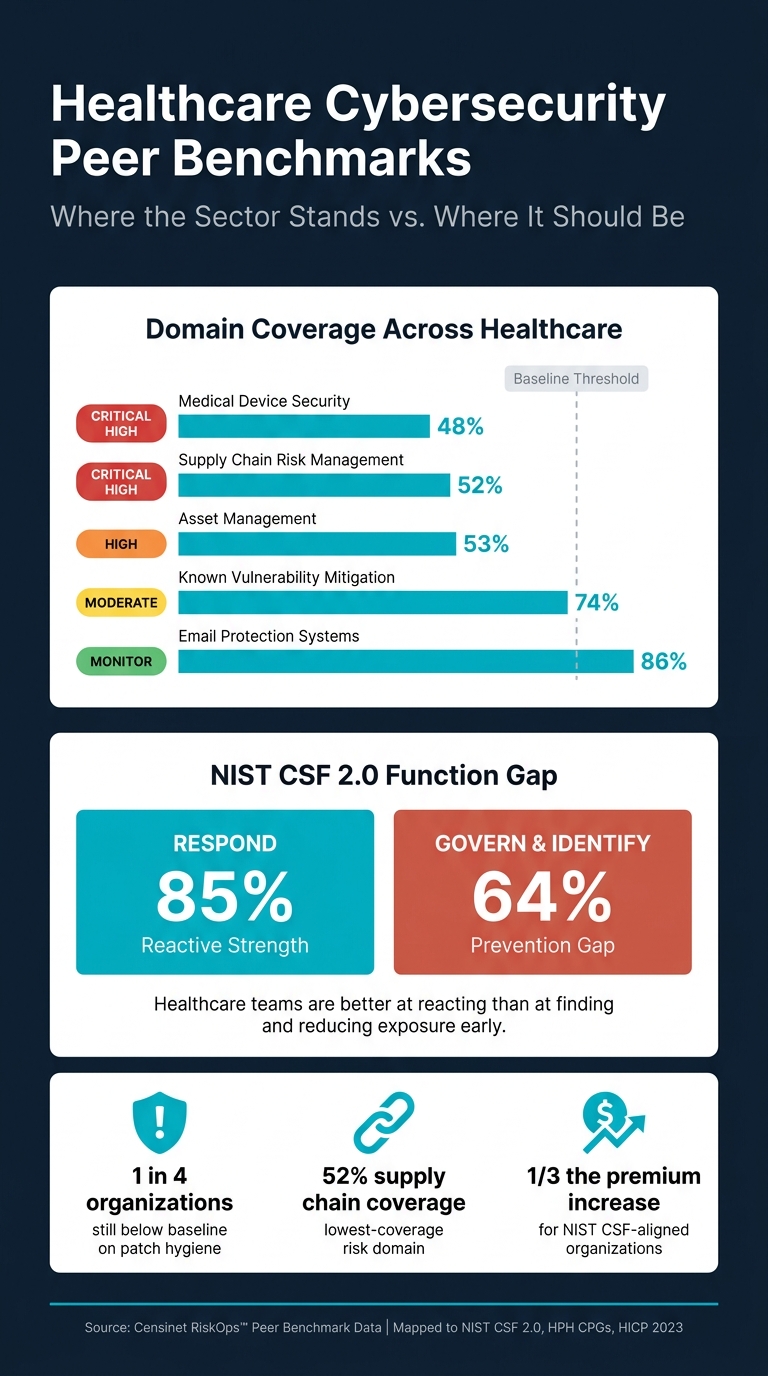
Healthcare Cybersecurity Peer Benchmarks: Coverage Gaps by Domain
Customer Conversations: The Value of Cyber Peer Benchmarking
sbb-itb-535baee
Quick comparison
| Area | Coverage | What it tells me |
|---|---|---|
| Email protection | 86% | Better covered, but still needs review |
| Known vulnerability mitigation | 74% | Patch lag still leaves room for attack |
| Asset management | 53% | Weak inventory often means hidden exposure |
| Supply chain risk management | 52% | Vendor risk remains a major problem |
| Medical device security | 48% | Device exposure still needs work |
I also take one other point from this: peer benchmarking is not about replacing internal reviews. It’s about checking whether my self-reported posture lines up with what the outside world can see, then mapping those findings to frameworks and budget decisions in a way leadership can use.
That is the core idea of the article: use network-observed data and peer context to build a plain, honest baseline - and then fix the areas that sit furthest behind.
What the network reveals about your posture
The clearest network signals fall into four buckets: exposure, patching, email security, and third-party links.
Exposed services and internet-facing weaknesses
Open ports and internet-facing services show your exposure footprint. Peer benchmarking helps you see whether that footprint is larger - or riskier - than what others in your space have. If peers have already closed off certain services and you still show them, that’s a clear warning sign.
Asset management tells a big part of that story. At 53% coverage, gaps in asset management still stand out as one of the clearest signs of hidden exposure [2]. In plain English, if you don’t have a clean inventory, you can’t cut down what you can’t see. That puts inventory accuracy first, then exposure reduction.
Patch hygiene and externally visible vulnerabilities
Externally visible vulnerabilities show how fast your organization deals with known issues. This is where peer comparison gets useful fast: you can spot which weaknesses others have already fixed and use that signal to rank your own gaps.
Coverage for mitigating known vulnerabilities in "Essential" HPH CPG goals is 74%, which means 1 in 4 organizations still sits below baseline [2]. So patch timing matters just as much as patch presence. A fix that arrives late can still leave the door open.
Email security and third-party connection signals
Email protection systems average 86% coverage, but phishing risk is still there [2]. Good email controls help, but they don’t erase the problem.
External signals can also point to vendor links and outside dependencies that deserve a closer look. That matters even more when the sector shows just 52% coverage for supply chain risk management [2]. If a third party has weak controls, that risk can travel.
The table below shows where peer coverage is strongest and where exposure is still concentrated [2].
| Signal Category | Average Industry Coverage | Primary Risk Area |
|---|---|---|
| Email Protection Systems | 86% | Phishing/operations |
| Mitigating Known Vulnerabilities | 74% | Patient Care/Exploitation |
| Asset Management | 53% | Asset visibility |
| Supply Chain Risk Management | 52% | Third-party risk |
| Medical Device Security | 48% | Patient Safety |
Those gaps are the raw material for risk prioritization.
How honest benchmarking changes risk decisions
Raw network signals matter only when they lead to action. Peer benchmarking helps teams turn exposure data into clear priorities for security, compliance, and board reporting. From there, the job is simple in theory, but hard in practice: turn those signals into a ranked risk list.
From observed signals to risk priority
Healthcare still puts more weight on response than prevention. Organizations average 85% coverage in the NIST CSF 2.0 "Respond" function, but only 64% in "Govern" and "Identify" [2]. That gap says a lot.
Peer comparisons help turn broad maturity scores into a practical remediation plan. If coverage is low in asset management and supply chain risk management, those gaps should move up the list first. Percentile views make that easier because they show where a team falls behind peers and where remediation is likely to have the biggest effect [1].
Once that priority list is set, the same findings need to be explained in different ways depending on who needs to act.
Mapping technical findings to framework-aligned reporting
Technical findings matter only if the audience can do something with them. A CISO can work from a list of exposed services. A board, on the other hand, needs context: How do these findings compare with peers, and what does that mean for risk?
That’s where framework mapping helps. When observed signals are mapped to NIST CSF 2.0, the HPH Cybersecurity Performance Goals, and HICP, the gap between technical detail and executive reporting gets much smaller [1].
For example, network segmentation sits at 56% coverage in the "Enhanced" HPH CPG goals [2]. On its own, that number may not say much to a board. Put it next to peer data, and it becomes a clearer way to judge whether current spending lines up with industry norms.
Comparison table: perceived posture vs. network-observed posture
The table below shows how internal assumptions often differ from what benchmarking surfaces, and what that means for risk priority.
| Posture Category | Perceived / Self-Reported Maturity | Network-Observed / Peer Benchmark | Implied Risk Priority |
|---|---|---|---|
| Incident Response | High (85% coverage) [2] | Peer Norm | Maintain and optimize |
| Supply Chain Risk | Low (52% coverage) [2] | Below Peer Norm | Critical High |
| Asset Management | Low (53% coverage) [2] | Below Peer Norm | High |
| Email Security | Moderate (86% coverage) [2] | Near Peer Norm | Monitor |
| Medical Device Security | Low (48% coverage) [2] | Below Peer Norm | High |
The gap between perceived control and observed exposure shows where risk still lives. That gap is what risk teams need to turn into day-to-day action next.
Operationalizing benchmarking with Censinet RiskOps™
Once the gaps are visible, the next move is action. Seeing the gap matters. But it’s only part of the work. You also need a system that helps your team act on what it sees in a steady way, across a large program, and in a format that makes sense to both security teams and boards.
Healthcare-specific benchmarking through a collaborative risk network
Censinet RiskOps™ centers on a collaborative risk network made up of healthcare delivery organizations (HDOs), health plans, pharmaceutical companies, and medical device manufacturers. Benchmarking only works when the peer group looks like your world. [1]
The platform turns de-identified peer data into maturity scores mapped to NIST CSF 2.0, HPH CPGs, HICP 2023, and the NIST AI RMF. It then shows gap-to-goal views against peer averages, so teams can see how far they are from peers in areas like supply chain risk management, where industry coverage is now just 52%. [2]
That peer view gives security teams something solid to work from when they need to justify remediation, staffing, and board reporting.
Faster third-party and enterprise risk analysis with Censinet AI™
The same network also helps teams move faster on third-party reviews. Third-party risk assessment is one of the most resource-heavy parts of a healthcare security program. Censinet AI™ helps vendors complete security questionnaires, summarize evidence, capture fourth-party exposure, and generate risk summaries from assessment data. [1]
Risk teams still keep final review authority. Findings are routed to the right stakeholders, including AI governance committee members, based on risk severity. [1]
Comparison table: internal assessments vs. network- and peer-driven benchmarking
The gap between a purely internal review and network-driven benchmarking becomes pretty clear when you line them up side by side. This table shows how each approach performs across the decisions that shape risk action most.
| Feature | Internal Assessments | Network- & Peer-Driven Benchmarking |
|---|---|---|
| Peer Baseline | No external reference point; relies on self-reported maturity | De-identified peer data across HDOs, payers, and vendors |
| Prioritization | Based on internal assumptions about control coverage | Ranked against peer averages to surface the highest-impact gaps |
| Vendor Intake Speed | Manual collection and review across each third party | Accelerated by collaborative data sharing and AI-guided automation |
| Board Reporting | Technical findings without peer context | Gap-to-goal views mapped to recognized frameworks for executive audiences |
| Framework Mapping | May use generic or outdated standards | Aligned to NIST CSF 2.0, HPH CPGs, HICP 2023, and NIST AI RMF |
Conclusion: Build a realistic baseline and use it to close gaps
That gap is exactly where peer benchmarking starts to pay off.
The benchmark data makes the shortfalls hard to miss: Respond sits at 85%, while Govern and Identify are both at 64%. Supply chain risk management is still the lowest-coverage area at 52%. [2]
Once you have that baseline, the next move is pretty simple: act on it. Map observed network signals to recognized frameworks, compare the results with de-identified peer data, and put budget toward the weakest domains first. Organizations that run this benchmark year after year improve across NIST CSF functions. [3]
For leadership teams, the business case is just as direct. Organizations using NIST CSF as their primary framework report cybersecurity insurance premium increases that are only one-third of what non-NIST CSF organizations face. [3] That's the kind of number that holds up in a board discussion.
The goal is an honest baseline and a focused plan to close the gap.
FAQs
How does peer benchmarking reveal hidden cyber risk?
Peer benchmarking adds hard, outside context to your security posture. Instead of looking at your program in isolation, it shows how your organization stacks up against similar peers in maturity, control coverage, and day-to-day performance.
That view can bring hidden cyber risk into plain sight. Maybe supply chain oversight is weak. Maybe asset visibility is limited. Maybe patching is uneven across teams or systems. Once those gaps are clear, leaders are in a much better spot to set priorities, back up security spending, and measure progress against frameworks like NIST CSF 2.0, HICP, and HPH CPGs.
Which network signals matter most in healthcare?
The most important signals are internet-facing services that are left exposed, patch hygiene, and the security of third-party and vendor connections. Other key indicators include MFA coverage, email protection, and weaknesses in medical devices or clinical systems.
Metrics like mean time to detect and mean time to contain help turn those signals into a clear fix-it plan and stronger resilience against ransomware and phishing.
How should we prioritize gaps below peer baseline?
Focus first on the gaps that hit operations and patient safety the hardest. Then look at where your gap-to-goal sits against the peer baseline, and tie each gap to next steps you can enforce or measure.
Use severity and care exposure to decide urgency. Put your attention on the control domains with the biggest impact first, so spending leads to better peer-aligned maturity and stronger resilience.
