
Healthcare cyber risk needs numbers you can track and context you can act on. In this piece, I’d sum it up like this: if you only look at breach counts, you’re too late. If you only look at maturity scores, you may miss where risk is building.
Here are the 7 KRIs that matter most:
- MTTD and MTTR to track how long attacks stay active
- PHI breach rate and ransomware impact to measure damage
- Endpoint, encryption, and MFA coverage to check control deployment
- Critical vulnerability age to see how long known gaps stay open
- Third-party risk indicators to track vendor exposure
- Program maturity and heat maps to rate control strength
- Workforce behavior and security culture to measure human risk
The article’s core point is simple:
- Quantitative KRIs give you hard data like days, percentages, counts, and dollars
- Qualitative KRIs explain what those numbers mean in practice
- You need both to judge cyber risk in a hospital or health system
A few numbers show why this matters:
- The average healthcare breach cost was about $7.42 million in 2025
- Ransomware downtime has been estimated at about $1.9 million per day
- In H1 2024, healthcare reported 387 large breaches
- 301 of them were hacking/IT incidents
- A phishing study across six hospitals found a median click rate of 16.7%
If I were setting up a dashboard, I’d keep it tight: track a small set of leading and lagging KRIs, assign one owner to each, and tie every red flag to a preset response. That’s the main takeaway.
Quick comparison
| KRI | What it shows | Type |
|---|---|---|
| MTTD / MTTR | Detection and response speed | Quantitative |
| PHI breach rate / ransomware impact | Privacy, downtime, and cost | Quantitative |
| Endpoint / encryption / MFA coverage | Control rollout gaps | Quantitative |
| Vulnerability remediation age | How long risk stays open | Quantitative |
| Third-party risk indicators | Vendor and supply chain exposure | Mixed |
| Program maturity / heat maps | Control strength by domain | Qualitative / ordinal |
| Workforce behavior / culture | Staff-driven risk | Mixed |
If you want a short answer, it’s this: the best healthcare cyber KRIs mix hard metrics with expert judgment, so leaders can spot risk early and act before care is disrupted.
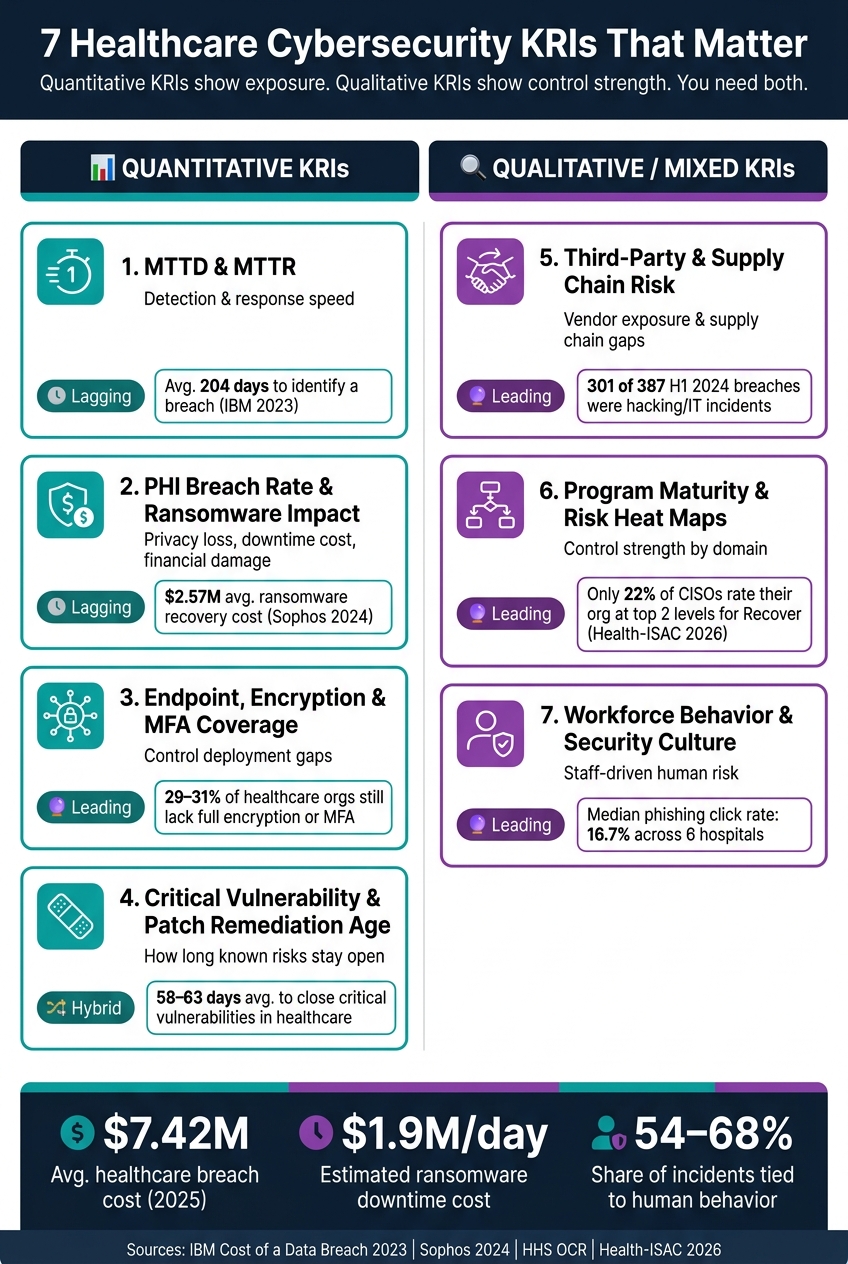
7 Key Risk Indicators for Healthcare Cybersecurity: Quantitative vs Qualitative
How to Identify Key Risk Indicators (KRIs) for Cybersecurity with Marta Palanques, Steve Reznik, ADP
sbb-itb-535baee
1. Mean Time to Detect and Mean Time to Respond
Mean Time to Detect (MTTD) tracks how long it takes to spot a security incident after it starts. Mean Time to Respond (MTTR) tracks how long it takes to contain the incident or recover from it after detection. Put them side by side, and you get a plain view of how long patient care and day-to-day operations stay exposed during an active attack.
To calculate them, use standardized incident timestamps: start, detection, containment, and recovery. One thing matters here: define MTTR one way and stick with it. It should mean either time to containment or time to full recovery. Those are not the same. Restoring a server is one thing; restoring safe clinical operations is another.
IBM's 2023 Cost of a Data Breach report found that organizations took an average of 204 days to identify a breach and 73 days to contain it.[2][3][7] Healthcare often takes even longer than that global average.[4][1][5] A 2025 Covenant Health incident shows why this metric matters so much: attackers stayed in the network for 8 days before detection, and the incident affected 478,188 patients.[6]
You should pull these timestamps from your SIEM, EDR/XDR, case-management tools, EHR logs, and postmortems. Relying on one ticket field can paint the wrong picture. Cross-checking several sources gives you a better read on what actually happened.
It also helps to break the numbers out by asset class and severity tier. If you lump a low-severity alert together with a high-impact ransomware event, the average can get distorted fast. Add a short note explaining period-over-period changes so leaders can read these metrics as risk signals, not just dashboard numbers. These speed metrics say the most when you pair them with breach impact measures like PHI exposure and ransomware disruption.
2. PHI Breach Rate and Ransomware Impact
PHI breach rate measures reportable PHI breaches per 10,000 patient encounters. For an outside benchmark, use the HHS OCR Breach Portal. It lists breaches affecting 500 or more individuals, along with the breach type and the number affected.[8][12]
Inside your organization, pull data from incident response tickets, compliance and risk registers, and SIEM logs. That gives you the full picture, not just the cases that end up in public reporting. It also helps to track the rate by breach type and affected population, so you can tell the difference between a one-off incident and a control problem that keeps showing up.
Counts alone don't tell the whole story. Split results into categories like:
- hacking/IT incidents
- network server
- third-party
That breakdown makes it easier for leadership to see where controls are failing most often.
In H1 2024, healthcare reported 387 breaches affecting 500 or more individuals. Of those, 301 were hacking/IT incidents, which made up 77.78% of the total and exposed more than 30 million individuals.[9] Put plainly, server and network security shouldn't sit in the IT corner. It belongs on the board's agenda.
Ransomware also needs its own dollar-based KRI. Sophos reported that the mean cost to recover from a healthcare ransomware attack reached $2.57 million in 2024, up from $2.20 million in 2023.[10][13][14] To make that metric useful, calculate average ransomware incident cost across three buckets: recovery and response costs, business interruption, and downtime or lost revenue.
The Change Healthcare attack in February 2024 shows why this matters. It compromised the PHI of an estimated 100 million individuals, disrupted claims, eligibility checks, and prescription workflows across the country, and led to an estimated $2.4 billion in response costs.[15][17][19] UnitedHealth reported $872 million in losses in Q1 2024, with full-year projections of $1.4 billion to $1.6 billion.[16][18]
The fallout didn't stop at finance.
The American Hospital Association found that 74% of nearly 1,000 surveyed hospitals reported direct patient care impact, including delays in authorizations for medically necessary care.[15][17]
That's why each ransomware incident should include a patient-safety flag in your tracking. Did it delay care, prescriptions, authorizations, or patient flow? That extra layer turns a money metric into a clinical safety signal. It also gives compliance teams a clearer record of how security gaps can lead to patient harm under the HIPAA Security Rule.
Censinet RiskOps™ can centralize risk assessments, benchmarking, and incident data.
If breach rate and ransomware impact show damage, the next KRI shows whether core defenses are actually deployed.
3. Endpoint, Encryption, and MFA Coverage
If breach rate and ransomware impact show the damage after an incident, endpoint encryption and MFA coverage show whether your main defenses are already in place.
The formula is simple: divide the number of protected assets by the total number of in-scope assets, then multiply by 100. Calculate encryption and MFA coverage separately. Track each as a percentage, then split the numbers by asset type and risk tier. For MFA, the denominator might be workforce accounts, remote-access accounts, privileged admin accounts, or all of them, depending on what you need to protect. The tricky part is scope. That includes managed endpoints, shared clinical workstations, remote access, EHR, email, admin consoles, and vendor connections that can reach PHI.[21][24][25]
A 2024 HIPAA trends survey found that 71% of healthcare organizations encrypt patient data and 69% use MFA. That leaves about 29% and 31%, respectively, with meaningful gaps.[20]
In healthcare, those gaps matter. An unencrypted lost laptop can turn into a reportable breach. A privileged account without MFA can hand an attacker a direct route into an EHR or an administrative system. Encryption and MFA help cut down device-loss breaches and credential abuse.
What makes this KRI useful is segmentation. A high top-line percentage can hide weak spots in the places attackers care about most. A 95% encryption rate may sound good, but it can still hide poor coverage across shared nursing-station workstations, biomedical device security risks, or contractor endpoints. MFA works the same way. If it's turned on for VPN but not for email or privileged admin accounts, one of the most common attack paths stays open.
Report coverage by:
- Device class
- User group
- Privilege level
- Environment
It's also worth watching the gap between installation and enforcement. A device is not protected if encryption is installed but turned off. MFA does not help much if users can bypass it through persistent sessions or exception accounts. Check coverage with MDM/UEM, IAM/SSO logs, EDR, directory services, and asset inventories so unmanaged devices don't slip through.[23][24][25] HHS 405(d) guidance backs this layered approach and recommends encrypted remote connections and MFA whenever possible.[22]
Once you know your coverage rate, the next issue is speed. How fast are exposed systems patched and remediated? The next KRI looks at that directly.
4. Critical Vulnerability and Patch Remediation Age
Coverage tells you what's installed. Vulnerability age tells you how long your team is living with risk.
This KRI tracks the number of days since discovery for open critical vulnerabilities on in-scope assets, including EHRs, medical devices, imaging systems, and revenue cycle platforms.
Age in days means the number of days since discovery for any open vulnerability. From there, track:
- average remediation time
- maximum open age
- the share of critical findings in these age bands: 0–30 days, 31–60 days, 61–90 days, and over 90 days [38]
That age-band view matters because healthcare guidance specifically flags vulnerabilities 60 days or older as much more likely to be exploited [38].
Best-practice SLAs recommend fixing critical vulnerabilities on internet-facing or PHI-processing systems within 24–72 hours, and high-severity findings within 7–14 days [26]. In practice, though, healthcare groups often take 58–63 days to close serious or critical vulnerabilities, and some studies show a 244-day half-life for serious findings [27][28][29][31]. That's a long time to leave the door cracked open. And in healthcare, the stakes aren't abstract. Unpatched flaws in connected medical devices or EHRs can disrupt care delivery and create patient safety risk [33][32][34].
FDA postmarket guidance gives medical device teams a clear floor to work from. Manufacturers should communicate a discovered vulnerability and any compensating controls within 30 days, and they should ship a validated, deployable patch within 60 days [39][40][41][42]. Treat those dates as the minimum bar, not the finish line.
To measure this KRI in a way that holds up, pull data from vulnerability scanners for CVE discovery dates, asset inventories to separate clinical systems from administrative ones, patch management tools for deployment dates, and ITSM/ticketing systems so each critical finding has a clear open and close timestamp [35][36][37].
When a fix depends on a vendor, the issue changes. At that point, you're not just tracking internal patch speed. You're tracking third-party security threats. For third-party products and medical devices, Censinet RiskOps™ can centralize vendor and product data and track manufacturer-led remediation [30].
5. Third-Party and Supply Chain Risk Indicators
When patching depends on a vendor, remediation age stops being just an IT metric. It becomes a supply chain risk. And when a supplier controls the fix, part of that risk sits outside your perimeter.
That matters a lot in healthcare. Third-party exposure is now a major breach driver, with business associates making up a growing share of healthcare breaches. Supply chain attacks can also interrupt patient care, which turns a security issue into an uptime and safety issue fast.[43][44]
Focus on four KRIs:[45]
- High-risk vendor percentage
- PHI accessible to third parties
- Assessment completion rate
- Days to remediate high-severity findings
Incomplete assessments are a warning sign. So are high-severity findings that stay open for more than 90 days.[45]
It also helps to look past the headline score. Rate each vendor on maturity, policy discipline, and alignment with frameworks such as HITRUST or NIST CSF. Then look at how they act in practice: Do they answer questionnaires on time? Do they provide SOC 2 materials without a fight? Do they cooperate during incident review? Slow or evasive responses are a red flag, even if the paper score looks fine.
Fourth-party risk adds another layer. Your vendors rely on suppliers too, and those suppliers can introduce hidden exposure. Cloud providers, AI suppliers, and software subcomponents can all affect PHI, clinical uptime, and recovery time. That’s why vendors should disclose sub-tier partners, material incidents, and recovery expectations.[45][46][47]
Censinet RiskOps™ centralizes vendor assessments, automates scoring, and tracks remediation across medical devices, clinical SaaS platforms, and revenue cycle partners.
Vendor exposure is only one layer. The next step is to see whether the program as a whole is getting better.
6. Cybersecurity Program Maturity and Risk Heat Maps
Single metrics can point to a gap. Maturity scores show the control environment behind that gap.
Most maturity models use Level 1 through Level 5 across areas like governance, risk management, IAM, response and recovery, and third-party risk.[50][51][52] Those scores become much more useful when you map them to likelihood and impact. That’s where a risk heat map comes in. It places each domain on those two axes and flags the highest-risk quadrant for immediate remediation.
The value of that approach shows up fast in healthcare. A 2026 Health-ISAC survey found that only 22% of CISOs rated their organizations in the top two levels for Recover. Meanwhile, 60% rated themselves Level 4 or 5 for Detect.[57] Put those numbers on a heat map and the story is hard to miss: the program may be good at spotting attacks, but weak at getting back to normal after one. A single rolled-up score could easily blur that difference.
The same numeric maturity score can also hide very different risk profiles. Two organizations may both land in the same range, yet one may face far more risk because of patient safety concerns, care continuity issues, or HIPAA exposure. That’s why expert scoring and narrative context matter. They help explain what the numbers mean in practice.
A solid assessment should rest on:
- framework-aligned control inventories
- evidence that controls are operating
- structured gap analyses[48][49][53]
The HHS RISC 2.0 cybersecurity module gives teams a consistent way to do that. It maps self-assessment questions to 206 NIST CSF subcategories and 20 HHS Cybersecurity Performance Goals, which helps make results comparable across facilities or regions.[54]
One hospital digital-service maturity assessment shows why this matters. It found an overall score of 2.17 against a target of 2.51, and the Identification domain scored the lowest at 1.65. That put it below both the Protection and Response & Recovery domains.[55][56] If leadership only looked at the overall average, they could miss the weakest domain and misread the program’s priorities.
Program maturity still depends on how people use the controls, which is the next risk signal to track.
7. Workforce Behavior and Security Culture Indicators
Human behavior is one of the biggest risk drivers in healthcare. In fact, people are tied to about 54%–68% of incidents, and healthcare tends to be hit harder than many other fields.[66][67][68] OCR breach data tell the same story: from 2015 to 2020, unintentional insider actions like mistakes, misdirected emails, and lost devices exposed more than twice as many records as malicious attacks.[69]
Phishing data makes the problem even more concrete. In a multicenter U.S. study covering more than 2.9 million simulated emails across six hospitals, the median click rate was 16.7%.[59][72] Another 20-campaign study found that 17.9% never clicked, while 65.3% clicked at least twice.[59][72] Repeated campaigns do bring click rates down over time. But there’s a catch: mandatory training by itself, even for higher-risk staff, showed only limited added effect.[59][71][73]
That’s why it helps to track these signals together instead of staring at one number in isolation:
- Phishing click rate shows susceptibility.
- Report rate and median time-to-report show how fast staff spot and flag threats.
- Repeat-offender rate points to employees who fail two or more simulations and need coaching, not just one more training module.
- Training completion rate, broken out by role and facility, confirms compliance, but it tracks process rather than behavior.
That last point matters. Healthcare organizations with mandatory programs often reach 85–95% on-time completion.[58][64] Sounds good on paper. But completion alone has shown no significant association with fewer phishing failures in simulations.[62] In plain English: checking the box doesn’t mean the lesson stuck. A qualitative security-culture score, drawn from manager input or employee survey results, helps fill that gap by showing attitudes and habits that raw click data can miss.
To build these KRIs, pull data from more than one system. Learning management systems (LMS) and HR platforms track completion, quiz scores, and overdue status by role and department. Phishing simulation platforms log click events, credential submissions, report rates, and time-to-report. SIEM and SOAR tools help connect simulation behavior to actual incident reports and response actions.[11][70][74][75]
Segmentation is where this gets useful. An organization-wide average click rate can look fine while a few teams are carrying most of the risk. Revenue cycle teams, front-desk staff, and scheduling coordinators often get hit with the most believable lures. If you want movement in the numbers, targeted micro-training usually does more than another annual module sent to everyone.[60][61][63][65]
These workforce signals make more sense when they’re paired with human judgment, which the next section covers.
How to Use Quantitative and Qualitative KRIs Together
Quantitative KRIs show exposure. Qualitative KRIs show control strength and day-to-day operating context. You get the clearest picture when both sit on the same dashboard.
That matters because one metric, on its own, can tell a half-story. A fast MTTR can make incident response look strong even when the process behind it is shaky. A high maturity score can look good on paper while patching still moves too slowly. When those signals pull in different directions, treat that gap as a risk signal, not a reporting mistake.
A top-level dashboard should track 5–10 core quantitative metrics. That usually includes current MTTR, PHI breach rate, endpoint and MFA coverage, critical vulnerabilities open for more than 30 days, high-risk vendor count, and phishing click rate. These metrics help quantify the economic impact of third-party risk across the organization. Then add a maturity scorecard with short gap notes. A risk heat map brings both views together by tying each placement to specific quantitative KRI data and a qualitative read on clinical workflow dependence or governance strength.
The table below shows how the seven KRIs fit into one reporting model.
| KRI | Measurement Method | Healthcare Risk Domain | Indicator Type | Reporting Format |
|---|---|---|---|---|
| 1. MTTD / MTTR | Quantitative (hours/days) | Incident detection & response | Lagging | Time-series charts |
| 2. PHI Breach Rate & Ransomware Impact | Quantitative (records, $, downtime hours) | Patient privacy, clinical ops, financial loss | Lagging | Quarterly counts, rates per 10,000 records |
| 3. Endpoint, Encryption & MFA Coverage | Quantitative (% of endpoints/users covered) | Technical controls & access management | Leading | Coverage gauges with policy-aligned thresholds |
| 4. Critical Vulnerability & Patch Remediation Age | Quantitative (days outstanding) | Infrastructure & application security | Hybrid | Median age, counts above defined age thresholds |
| 5. Third-Party & Supply Chain Risk Indicators | Mixed (counts/scores + qualitative risk ratings) | Vendor risk, medical devices, supply chain | Leading | Risk tier summaries, assessment completion rates |
| 6. Cybersecurity Program Maturity & Risk Heat Maps | Qualitative / Ordinal (maturity levels, heat map colors) | Governance, processes, enterprise risk posture | Leading | Maturity scorecards (e.g., NIST CSF Tier 2–3), visual heat maps |
| 7. Workforce Behavior & Security Culture Indicators | Quantitative + Qualitative (click rates, survey sentiment) | Human factors, clinical workflow risk | Leading | Trend charts plus qualitative themes by department or role |
Tagging each KRI as leading, lagging, or hybrid matters more than it may seem. Boards and risk committees make very different calls depending on whether a metric shows current exposure or harm that has already happened. A simple visual split helps:
- Put leading indicators in one section.
- Put lagging indicators in another.
- Mark hybrid metrics clearly so they aren't read the wrong way.
That setup makes it harder for leaders to see a low breach rate and assume controls are fine, while leading indicators are quietly flashing yellow.
For third-party exposure, Censinet RiskOps™ can feed vendor counts, assessment completion rates, and dependency context into the same dashboard. Use that setup to assign owners, set thresholds, and define reporting cadence. Next, translate these KRIs into thresholds, owners, and reporting cadence.
Implementation Tips for U.S. Healthcare Organizations
Once you’ve picked your KRIs, the next step is to turn them into clear thresholds, named owners, and a reporting schedule.
Start by converting each quantitative and qualitative KRI into a decision rule tied to your organization’s risk appetite for patient safety, HIPAA compliance, financial loss, and operational disruption. In plain English: decide what’s acceptable, what’s a warning sign, and what calls for action right now.
Then translate that into green/yellow/red thresholds and get board or risk committee approval as part of the enterprise risk management (ERM) framework. For example, you might define breach thresholds like this:
- Green = zero reportable breaches
- Yellow = one limited breach
- Red = any breach affecting 500+ individuals
Those thresholds shouldn’t sit on a shelf. Review them every year and again after a major event, such as ransomware or a merger. Each threshold also needs a preset response, like a review, an escalation, or even a workflow pause. If a metric turns red, people should already know what happens next.
Next, tie each KRI to the safeguard it measures. This is where KRIs stop being abstract scorecards and start pointing to action. Map each KRI to the HIPAA safeguard it tests: MTTD/MTTR links to audit and integrity controls; breach and ransomware impact link to incident response and contingency planning; endpoint, encryption, and MFA coverage link to access, authentication, and transmission security; and third-party risk links to business associate oversight and risk management. When a KRI starts drifting in the wrong direction, that map shows where to look first.
It also helps to give each KRI a second reference point with NIST CSF 2.0 functions and HHS 405(d) practices. MTTD/MTTR lines up with the Detect and Respond functions. Endpoint and MFA coverage line up with Protect, especially PR.AC, PR.DS, and PR.PT. Third-party and supply chain indicators line up with Identify, especially ID.SC. The HHS 405(d) HICP framework points to five core healthcare threat areas: phishing, ransomware, theft, insider data loss, and attacks on connected medical devices. Use HHS 405(d) resources to rank threats, compare current safeguards, and spot gaps.[76][77] That pairing of threats and practices helps you pick KRIs based on actual exposure, not generic IT activity.
After the control mapping is done, assign ownership. Each KRI should have one clear owner. That means SOC for MTTD/MTTR, privacy/compliance for breach rate, IT infrastructure for endpoint and MFA coverage, clinical engineering as a co-owner for patch age on medical devices, vendor management for third-party risk, and a board-level cyber risk committee for oversight.[78] If ownership is fuzzy, follow-up tends to get fuzzy too.
For third-party and supply chain KRIs, Censinet RiskOps™ can bring vendor assessments into one place, standardize healthcare-specific questionnaires aligned to HIPAA, NIST CSF, and 405(d), and connect findings to designated owners so remediation can be tracked across a large vendor ecosystem.
Then set reporting frequency based on who’s reading it. Operational teams usually need weekly or daily dashboards for fast-moving metrics like MTTD/MTTR and vulnerability age. Executive leaders such as the CIO, CISO, COO, and CMO usually do best with monthly or quarterly summaries tied to business impact. Boards and risk committees usually want quarterly or semiannual briefings centered on PHI breach rate, ransomware incidents, program maturity, and third-party risk, with comparisons against peer organizations or industry norms.[78]
For board reporting, less is more. Keep it to a small set of KPIs, use the same red/yellow/green scoring every time, and lead with what changed.
Conclusion
No single metric can sum up healthcare cyber risk. Quantitative KRIs show exposure. Qualitative KRIs show where controls are weak and what’s happening on the ground.
The stakes aren’t abstract. Ransomware has been linked to a 34–38% rise in in-hospital mortality and to care disruption through downtime, canceled procedures, and ambulance diversions.[79][80] That’s why simple beats bloated: it’s better to start with a small set of KRIs and make them tighter over time.
A practical way to do this is to start with one KRI in each of the seven categories, give each one a clear owner, and set thresholds that trigger a fixed response. Then refine the dashboard based on what actually predicts problems inside your organization.
For third-party risk, keep vendor assessments and remediation in one place. This often starts with standardizing third-party risk assessment questions to ensure consistency. Censinet RiskOps™ can centralize vendor assessments, benchmarking, and corrective workflows.
Used together, these seven KRIs give leaders an early warning system and a shared view of risk, so clinical and security teams can step in before disruption reaches patients.
FAQs
Which KRIs should a hospital track first?
Start with a lean set of KRIs across four areas: technical exposure, identity, third-party risk, and medical device security.
Track critical patching, PHI system encryption coverage, MTTD/MTTR, MFA coverage, the percentage of critical vendors assessed and the aging of open high-risk findings, plus medical device inventory completeness and the percentage with known exploited vulnerabilities or without validated network segmentation.
How do qualitative KRIs improve hard metrics?
Qualitative KRIs make hard metrics more useful because they add the context behind the numbers. They help explain why a metric moved, not just what changed.
When you pair them with numeric thresholds and documented risk scenarios, reporting becomes less subjective and easier to act on. That gives leadership a clearer read on shifts in quantitative data and helps them respond in the right way, while also supporting more stable and comparable measurement over time.
How often should healthcare cyber KRIs be reviewed?
Review frequency should match how critical the system is and how fast risk can change.
For patient-safety-critical systems, review KRIs in near real time or at least every hour. For administrative systems, a weekly or monthly review may be enough.
A cross-functional governance committee should formally review KRI performance every quarter. Audit alert quality every 3 to 6 months so thresholds stay in line with what’s happening. And after any major system change, re-baseline the KRIs that apply for 30 to 90 days.
