If I want incident data to help me prevent the next problem, I need to do four things: standardize records, track the right metrics, review patterns on a set schedule, and tie findings to named actions.
One incident tells me what happened. A trend tells me where controls, workflows, systems, or third-party vendors keep failing. In U.S. healthcare, that matters because cyber events can disrupt care, delay imaging, force downtime procedures, and add direct costs in U.S. dollars.
Here’s the short version:
- Use one incident format for every record
- Classify incidents the same way across teams and sites
- Add care impact, not just technical details
- Track rates, not just totals, so large hospitals do not skew the picture
- Review repeat patterns by system, vendor, department, and time period
- Check root causes within 3–5 business days
- Turn repeat issues into assigned fixes with deadlines and closure criteria
- Report monthly and quarterly for different audiences
A few numbers show why this matters:
- In 2025, nearly 500 healthcare breaches affected 37.5 million people in the U.S.
- Providers accounted for 76% of incidents
- Critical healthcare incident response often lands in the 32–48 hour range for MTTR
- 70% of U.S. hospital boards now include cybersecurity in risk oversight
What I take from this is simple: counting incidents is not enough. I need data that shows which failure modes repeat, where patient care is strained, how long recovery takes, and which fixes should get budget first.
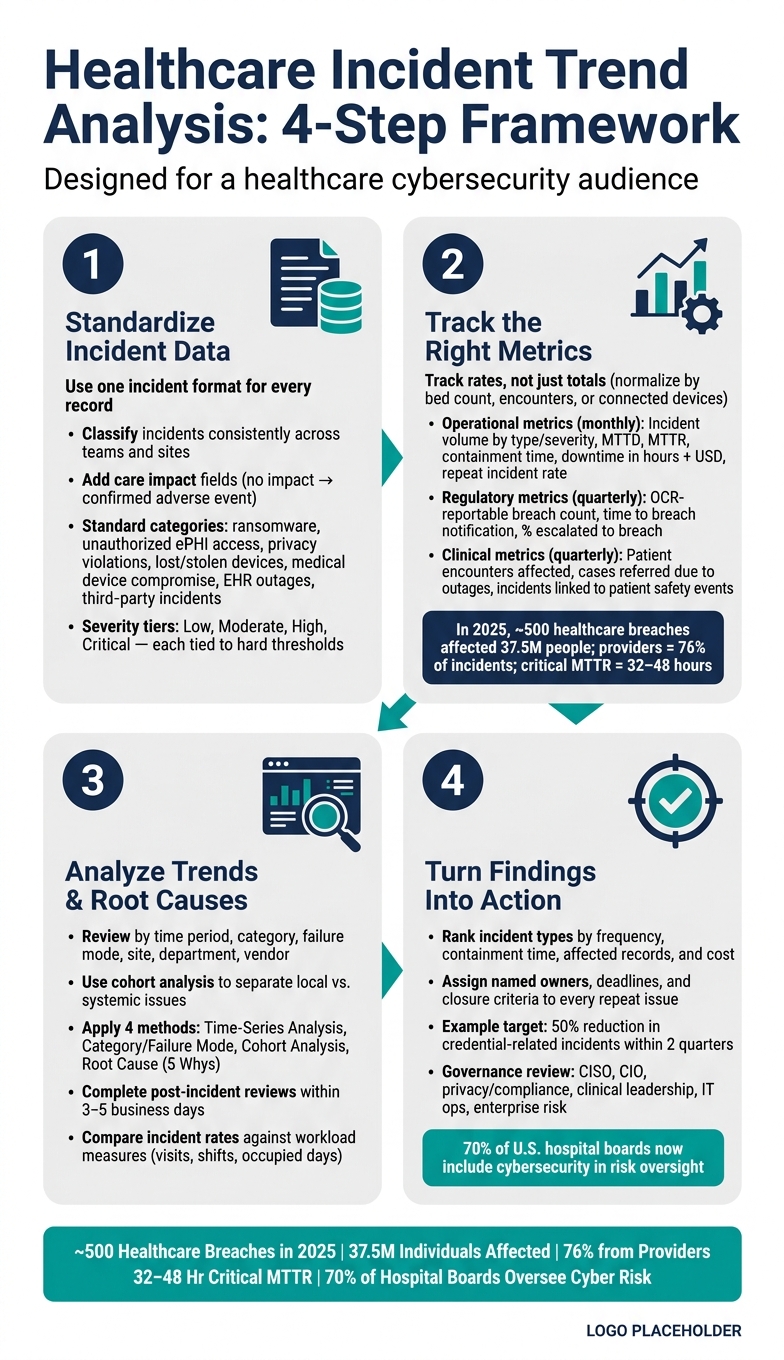
Healthcare Incident Trend Analysis: 4-Step Framework
Full HSE Incident Analysis in Power BI - From Raw Data to Management Insights
sbb-itb-535baee
Quick comparison
| Focus area | What I look for | Why it matters |
|---|---|---|
| Data standardization | Shared categories, severity rules, fixed fields | So I can compare incidents across sites and time periods |
| Metrics | Volume, MTTD, MTTR, downtime, repeat rate, breach count | So I can see change over time |
| Analysis | Time trends, cohorts, failure modes, root cause | So I can separate one-off events from repeat problems |
| Action | Control changes, owners, deadlines, governance review | So the analysis leads to fewer repeat incidents |
If I do those four things well, incident trend analysis becomes a working part of cyber risk management instead of a report that gets filed and forgotten.
1. Standardize the incident data you will analyze
Standardized records make incident analysis a lot more useful. They let you compare events across sites, vendors, and time periods without mixing apples and oranges. Start with a shared taxonomy, then apply the same schema to every record.
Define incident categories and severity levels
Begin by getting clear on what counts as what. At a minimum, your taxonomy should cover ransomware attacks, unauthorized access to ePHI, privacy violations, lost or stolen devices, medical device compromise, application/EHR outages, and third-party vendor security threats. Each category needs clear inclusion and exclusion rules so people classify incidents the same way every time.
Severity levels should link to hard thresholds, not gut feel. A tiered model - Low, Moderate, High, Critical - works well when each level maps to set thresholds for downtime, records affected, patient safety impact, and financial impact in U.S. dollars. That should include direct response costs, overtime, lost revenue from canceled appointments, and possible regulatory penalties.
Once you lock in the categories, every incident can be logged in the same way and compared on equal terms.
Create a single source of truth for incident records
Each incident record should contain the same core fields: date and time of detection or occurrence (in MM/DD/YYYY HH:MM AM/PM format, with time zone), affected asset or system, business unit or clinical area, incident type, severity level, root cause, mitigation status, and notification or review flag.
The affected asset or system field should match your asset inventory or CMDB so reporting stays consistent across EHRs, PACS, medical devices, and network segments. For root cause, use standard codes - misconfiguration, phishing, unpatched vulnerability, vendor failure, workflow error - instead of free-text notes that change from one reporter to the next.
A central repository such as Censinet RiskOps™ helps enforce one schema, supports access controls and audit trails for compliance and reporting, and stores vendor and business associate indicators as standard fields rather than buried in optional notes.
With one record structure in place, trend analysis can shift from raw events to business impact.
Connect cyber incidents to clinical and operational context
Don’t stop at the technical event. Record the care impact of each incident too. Every record should include a patient care impact field that lines up with your current patient safety taxonomy: no impact, near miss, potential adverse event, or confirmed adverse event.
You should also quantify workflow disruption, including:
- Number of appointments rescheduled
- Manual downtime procedures invoked
- Overtime hours logged
Where possible, link cybersecurity incident workflows with safety and quality reporting tools so clinicians can flag care impacts while security teams document the technical side.
For example, a PACS outage that delays imaging, forces manual workarounds, and adds overtime carries a very different risk profile than a high-severity label by itself. Clinical impact fields make it easier to rank repeat incidents by operational strain and patient risk, which makes later trend comparisons more useful for both security and patient safety.
That context makes later trend comparisons useful for both security and patient safety.
2. Define the metrics and views that reveal trends
Once your incident records are standardized, you can track the metrics that show volume, severity, and response performance. That’s what makes apples-to-apples comparisons possible across sites, systems, and time periods. Without standard records, trend lines get muddy fast.
These measures help you see whether incidents are going up, leveling off, or showing up in more parts of the organization.
Track volume, severity, and response performance
Track both incident volume and response performance.
For incident volume, look at incident volume by type, blocked attempts, OCR-reportable breach count, MTTD, MTTR, containment time, economic impact of downtime per incident in hours and USD, and repeat incident rate by system, vendor, or department.
The scale matters here. In 2025, nearly 500 healthcare breaches affected 37.5 million individuals in the U.S., with providers accounting for 76% of incidents.[3] HIMSS 2023 cybersecurity survey data shows healthcare MTTR for critical incidents often falls in the 32–48 hour range, which speaks to how hard it can be to respond inside clinical settings.[2]
Normalize data for fair comparisons across the organization
Raw totals only tell part of the story. A large hospital will almost always log more activity than a small site, so normalize the data before comparing units.
Use bed count for hospitals, encounters for ambulatory networks, and connected devices for high-IoT environments. That gives you a fair cross-site view across business units and reporting periods. Also, make sure the source data behind those calculations - bed census, EHR encounter logs, and device inventories - is updated at least monthly.
KPI comparison table: operational, regulatory, and clinical metrics
Use the same data to build operational, regulatory, and clinical views for different audiences.
| Metric | Category | Reporting Cadence |
|---|---|---|
| Incident volume by type and severity | Operational | Monthly dashboard |
| MTTD (Mean Time to Detect) | Operational | Monthly dashboard |
| MTTR (Mean Time to Respond) | Operational | Monthly dashboard |
| Containment time (ransomware, account compromise) | Operational | Monthly dashboard |
| Downtime per incident (hours + estimated USD impact) | Operational | Monthly dashboard |
| Repeat incident rate by department, vendor, or system | Operational | Monthly dashboard |
| OCR-reportable breach count and affected individuals | Regulatory | Quarterly board report |
| Time to breach notification decision | Regulatory | Quarterly board report |
| Percent of incidents escalated to breach notification | Regulatory | Quarterly board report |
| Patient encounters affected by cyber-related downtime | Clinical | Quarterly board report |
| Cases referred to neighboring facilities due to outages | Clinical | Quarterly board report |
| Incidents linked to patient safety events | Clinical | Quarterly board report |
Monthly dashboards should stay focused on operational metrics. Quarterly board reports should shift toward regulatory outcomes and clinical impact. That way, cybersecurity reporting doesn’t sit in a silo - it connects directly to patient safety and organizational accountability.
Next, turn these metrics into a repeatable analysis workflow that separates patterns from one-off events.
3. Analyze trends and root causes with a repeatable workflow
Use these metrics to spot patterns that keep coming back, confirm root causes, and decide what to fix first.
Review trends by time, category, and business segment
Begin with changes in incident volume and severity. Then dig into category, failure mode, and site, department, device class, application, or vendor to see where repeat activity is piling up.
That second step matters. A jump in volume doesn't always mean controls got worse. Sometimes demand just went up. So compare incident rates against workload measures like patient visits, shifts, or occupied days. That makes it easier to tell whether a spike is tied to demand or points to weakening safeguards.[1]
Cohort analysis helps a lot here because it separates local trouble spots from issues that cut across the whole organization.
Perform root cause analysis on recurring incidents
When the same incident type keeps showing up, a quick patch usually won't stick. Look at logs, config changes, user behavior, and workflow gaps together instead of in isolation.
Then ask a harder question: why was the clinical impact as serious as it was? Did workarounds fail? Did a clinical application lack redundancy?[4]
Use a blameless review process to find system gaps, not pin the problem on one person. Every high-priority incident should also include a documented breach assessment, even if no breach happened, to show regulatory due diligence.[4]
Speed matters here. Post-incident reviews (PIRs) should be completed within 3–5 business days. After that, details fade fast, and reviews done after two weeks lose most of their use.[4]
Analysis method comparison table
Each method below helps with a different call. The point isn't to lean on just one. Use them together across review cycles.
| Analysis Method | Data Required | Decision Supported | When to Use |
|---|---|---|---|
| Time-Series Analysis | Incident timestamps, volume counts | Are incidents increasing or shifting in character? | To establish whether controls are improving or weakening over time |
| Category/Failure Mode | Failure mode tags (e.g., handoff breakdowns, documentation lags, supervision gaps) | Which specific operational controls need redesign or training? | When targeting remediation at a specific control or process |
| Cohort Analysis | Facility, department, or device class | Is risk concentrated in a specific team, vendor, or location? | To distinguish localized issues from systemic problems |
| Root Cause (5 Whys) | Logs, configuration history, user behavior | Why did the incident recur? What systemic gap allowed it? | For all high-priority incidents or recurring low-level clusters |
Use what you find to assign owners and match the fix to the problem. Some issues call for process changes. Others point to training, config updates, or tighter backup controls. The next step is turning those repeat patterns into action.
4. Turn findings into cybersecurity and risk management action
Once the trends are clear, the next move is simple: turn them into funded controls and assigned work. Analysis only matters if it changes what people do. The aim is fewer incidents, faster response, and less risk to patients.
Prioritize controls based on frequency and impact
Start by ranking incident types using factors like frequency, containment time, affected records, and cost. Then use that ranking to fund the controls most likely to reduce repeat risk.
This works best when each control ties to a measurable target linked to a clear incident pattern. For example, a team might target a 50% reduction in credential-related incidents within two quarters by rolling out phishing-resistant authentication and privileged access management. Each control should also connect to a risk-register metric and a budget owner.
That ranking should feed straight into remediation planning and budget decisions.
Build trend reviews into governance and risk processes
Use a multidisciplinary committee to review what matters most. That usually includes the CISO, CIO, privacy and compliance officers, clinical leadership, IT operations, and enterprise risk management. The group should review high-severity incidents every month and update risk appetite, risk registers, and vendor posture every quarter. Focus those reviews on incident trends, remediation status, third-party risk, and patient-safety impact.
The American Hospital Association reports that 70% of U.S. hospital boards have included cybersecurity in their risk management oversight.[6]
That level of board involvement puts cyber risk where it belongs: next to clinical and operational risk. Trend reviews should connect directly to board and executive approval for controls, budget, and ownership. Every repeat issue should go into a formal plan of action and milestones, with a named owner, a deadline, and clear closure criteria.[5]
With governance in place, execution needs to stay visible and easy to track. This transparency is a key part of creating a culture of cybersecurity across the organization.
Use integrated platforms to scale analysis and follow-through
As incident volume grows, manual follow-up starts to crack. Spreadsheet-based tracking slows trend analysis, and scattered emails make remediation hard to manage. Centralized platforms keep incident data, risk assessments, and remediation in one workflow.
Recurring patterns only matter if they trigger assigned remediation. Censinet RiskOps™ connects each repeat issue to the risk register and the remediation owner. That means vendor-related PHI exposure patterns can link back to existing risk assessments, gaps can be flagged, and corrective actions can be tracked through closure.
| Aspect | Manual Spreadsheet Tracking | Platform-Based Analytics |
|---|---|---|
| Data quality | Inconsistent fields, manual errors, and duplicate records are common | Standardized schemas and validation rules improve consistency |
| Timeliness of insights | Trend analysis often delayed until quarterly manual consolidation | Dashboards that update as incidents and tasks are logged |
| Workflow and follow-through | Remediation tracked in disparate emails and files | Integrated task routing and status tracking across all stakeholders |
The result is faster closure and better accountability.
Conclusion: Build a repeatable incident trend analysis program
The last step is turning trend analysis into a regular management habit. Incident trend analysis shouldn't live as a one-off report that gets reviewed once and forgotten. The teams that cut repeat incidents fastest treat it as a steady cycle tied to incident data, metrics, analysis, and action.
Boards and regulators now expect leaders to explain emerging risk patterns, not just past incidents. [1]
Key takeaways for healthcare leaders
For healthcare leaders, the message is straightforward: Standardize incident data in a single source of truth. Normalize KPIs so workload is factored in, which helps keep rising counts from being mistaken for volume-driven noise. [1] Analyze trends on a set cadence - near-misses weekly, recurring low-level themes monthly, and escalate repeat patterns when thresholds are met. Act by linking major findings to staffing, training, service redesign, and governance decisions.
When those pieces work together, trend analysis helps teams spot risk earlier and make faster operational decisions.
Censinet RiskOps™ can support this model with unified risk assessments, cybersecurity benchmarking, and collaborative workflows.
FAQs
How do I start if my incident data is inconsistent?
Start with a standard system for classifying incident severity, incident type, and response priority. Then use automated monitoring tools to make data collection more accurate and keep reporting consistent across your organization.
Censinet RiskOps can help by putting risk records, assessments, and documentation in one place. Clear, predefined incident documentation rules also cut manual errors and give you a more reliable base for spotting trends and improving your cybersecurity strategy.
Which incident metrics matter most for patient care risk?
Healthcare organizations should focus on the numbers that show speed, exposure, and recovery.
That means looking at how fast incidents are contained and fixed, how much sensitive data is put at risk, and how well clinical systems come back after a disruption. The main metrics here are MTTC, MTTR, ePHI exposure incidents, and recovery times.
It also helps to track unresolved critical vulnerabilities and business continuity plan success. Those measures can cut down on disruptions that may affect patient safety.
How often should healthcare teams review incident trends?
Healthcare teams should review incident trends on a set schedule, whether that's weekly, monthly, or quarterly. That routine gives teams steady access to insights they can act on.
AI-powered dashboards can help with continuous or near real-time monitoring. But scheduled reporting still matters. It gives leadership and operational managers a clear, steady view of how trends are changing over time.
Censinet RiskOps™ supports both needs with automated reporting and real-time visibility.
