
If you monitor the wrong signals, medical device issues can look like random noise until care is affected. I’d focus on 15 core metrics: traffic volume, timing, idle behavior, endpoints, uptime, latency, packet loss, wireless quality, CPU, memory, storage, heat/power, login activity, firmware drift, and reboot/error patterns.
Here’s the short version: baselines come first. A pump sending more data at 2:00 p.m. may be normal. The same spike at 3:00 a.m. may not. In many cases, teams need 30 to 90 days of telemetry to learn what “normal” looks like by device type, care area, time of day, and maintenance window.
If I were setting up device behavior monitoring, I’d track these signals first:
- Flow volume and data rate to spot spikes, drops, or missing telemetry
- Flow duration and communication interval to catch cadence changes and beaconing
- Idle time and sleep behavior to find devices that stay active when they should be quiet
- Remote endpoints and port usage to flag new destinations, odd ports, and protocol drift
- Online/offline status and reconnection attempts to find flapping devices and access issues
- Latency and response time to see whether devices are keeping up with care needs
- Packet loss and retransmissions to catch missing data even when delay looks normal
- Signal strength and SNR for mobile and Wi-Fi-based devices
- CPU and memory usage to spot overload, leaks, bugs, or malware-like activity
- Storage and log growth to find disk pressure, log suppression, or local data staging
- Operating temperature and power draw to spot strain, hardware trouble, or odd background activity
- Authentication failures and access attempts to catch brute-force patterns and account misuse
- Firmware version and update behavior to find off-schedule changes and failed integrity checks
- Error codes, reboots, and startup issues to catch boot loops, faults, and tampering signs
A few numbers help show what “drift” can look like:
- In one cited device traffic study, 95% of flows were under 300 KB
- 61% of flows were under 100 KB
- Most flows lasted less than 10 seconds
- On stable networks, packet loss often stays near 0%
- Normal embedded device CPU load often sits around 10% to 40%
- Disk use moving from 50% to 85%–90% in 24–48 hours without workload growth is a red flag
The main idea is simple: don’t judge a metric by itself. I’d read each alert with device context, patient risk, timing, firmware state, and network history using RiskOps for healthcare. That’s how you tell the difference between a normal overnight update and a device that needs attention now.
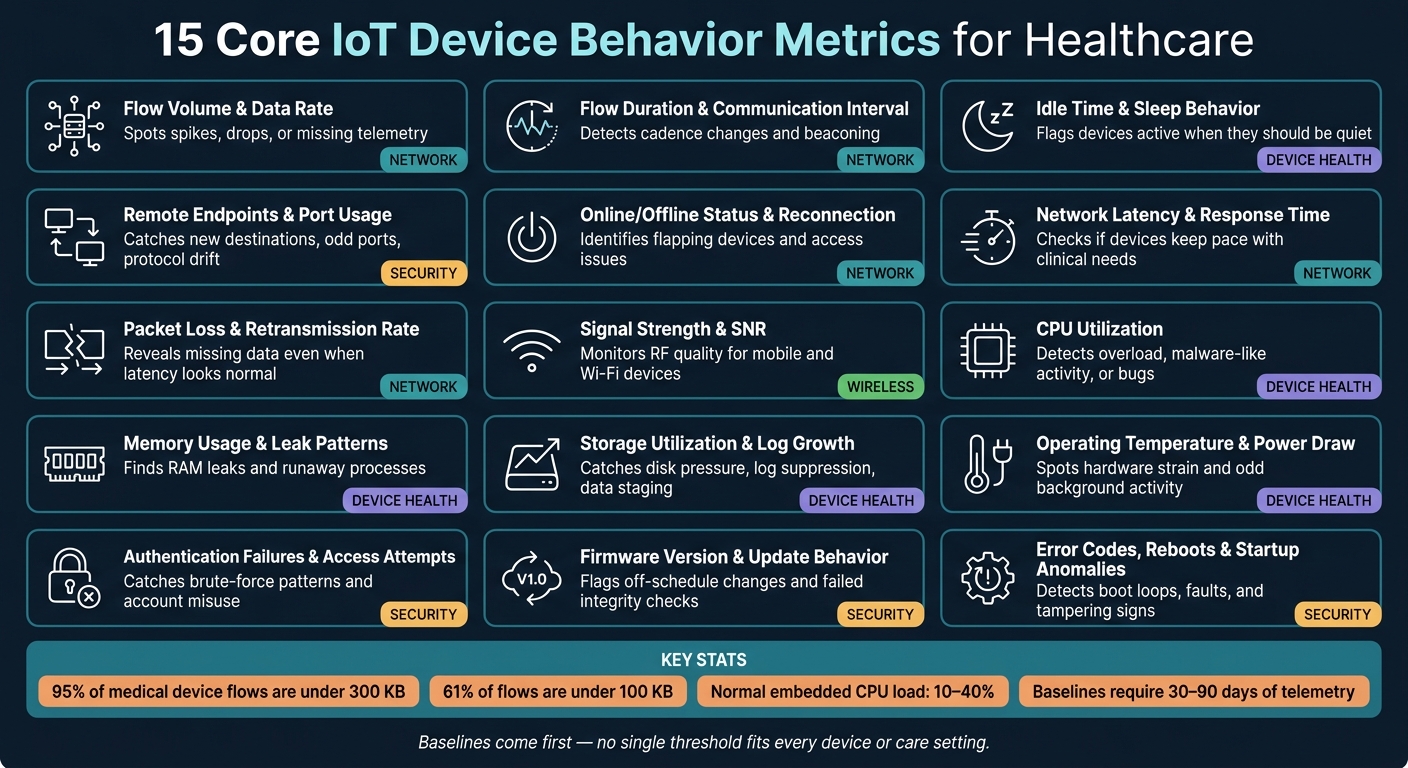
15 IoT Device Metrics to Monitor in Healthcare
IoTProMo: Securing IoT Networks using Device Profiling and Monitoring by Alireza Zohourian
sbb-itb-535baee
Why Baselines Come First
A data transfer spike on an infusion pump during a busy daytime ICU shift might be perfectly normal. Nurses are changing medication rates, charting care, and the pump is syncing with clinical middleware. That exact same spike at 3:00 a.m. in a long-term care facility tells a different story.
That’s why baselines need to come before thresholds. Every device class has its own normal pattern. A radiology workstation can legitimately sit at 80–100% CPU during scan reconstruction or compression. A bedside patient monitor running at that same level for hours is a different matter if its normal steady state is only 10–20%. Ventilators in an ICU talk more often than ventilators in a step-down unit. Emergency departments are messy by nature, so device usage swings all over the place. No single threshold fits every device or unit.
Good baselines should reflect the things that shape day-to-day behavior:
- device type
- care setting
- workflow
- time of day
- maintenance windows
For example, quiet periods between 1:00 and 4:00 a.m. in medical-surgical units should have tighter alerting because there’s usually less legitimate clinical activity during those hours. On the other hand, if monthly firmware updates run on weekend nights, then expected reboots, brief offline periods, and heavier data transfers to vendor servers should be marked as normal for those windows, not treated like incidents.[5]
Communication baselines need the same level of detail. Each device class should have documented approved destinations, protocols, and ports. If an infusion pump suddenly starts outbound traffic to an unknown external IP range, that’s anomalous not because the volume is high, but because that destination was never part of the baseline. The same logic applies to firmware. Baselines should track approved version ranges for each device model so silent version changes or unscheduled updates stand out right away. Unknown destinations, unknown ports, and unscheduled firmware changes are all signs of suspicious activity.
Most environments need 30–90 days of observed telemetry to build baselines that reflect day-of-week variation, shift patterns, and seasonal workflow changes.[4] It also helps to centralize device and risk context so anomalies immediately show ownership, criticality, and exposure. That’s what turns a metric deviation into something a team can act on, instead of just another strange data point.
With the baseline set, the next metrics show where behavior starts to drift.
1. Flow Volume and Data Transfer Rate
Flow volume is the total amount of data a device sends or receives during a set period. Data transfer rate shows how fast that data moves, usually in bits per second, kilobits per second, or megabits per second.
These are the first things to track because odd jumps, sharp drops, or missing telemetry often show up here before anything else. Once you know what normal traffic looks like, unusual behavior stands out much faster.
A recent analysis of network traffic from eight medical devices found that 95% of network flows were under 300 KB and 61% were under 100 KB. Most flows also lasted less than 10 seconds.[9] That kind of consistency makes outliers easier to catch.
Baseline Deviation Severity
Don’t look at deviation by itself. You need to read deviation, duration, and timing together. A 20% increase during a known update window may be routine. A 300% spike at 2:00 a.m. from a single infusion pump is a very different story and needs immediate review.[9][11]
Patient Safety Impact
A drop in expected flow can be just as risky as a spike. If a bedside monitor or ventilator stops sending data, clinicians may lose access to timely patient information. On the flip side, if traffic floods the network, alerts can get buried.[1]
Security Signal Strength
Changes in flow often appear before a clinical failure does. Malware, beaconing, unauthorized access, and exfiltration can all change how a device communicates.[10]
Incident Triage Value
For triage, compare the event against the baseline, then check the timing, traffic direction, endpoint, and any maintenance window. It also helps to pair flow data with DHCP, DNS, authentication logs, endpoint identity, and firmware records. That extra context helps separate routine workload changes from actual incidents.[8]
Flow volume and rate tell you how much a device is communicating. The next metric looks at how long each exchange lasts.
2. Flow Duration and Communication Interval
Flow duration shows how long a device keeps a communication session open. Communication interval shows how often it starts those sessions. Put those two together, and you get the device’s normal rhythm. When that rhythm changes, something is often off.
Flow volume tells you how much a device talks. Duration and interval tell you when it talks. Many devices work on fixed schedules: seconds for ECG sensors, minutes for pumps, and hours for temperature sensors.[6][16] That kind of steady timing is normal. The red flag is irregular timing. If a device starts checking in more or less often than its defined time profile, that change deserves a closer look.[16] Then the next step is simple: figure out whether the shift is brief or keeps going.
Baseline Deviation Severity
Track how long a device stays outside its normal pattern so you can tell the difference between a short glitch and a lasting problem. Use multiple time windows to catch idle, active, and boot states.[12][14]
Patient Safety Impact
If telemetry stops for several minutes, clinicians can miss signs that a patient is getting worse. If a pump or ventilator stays stuck in a long session, updates and configuration changes move more slowly, and that can hit care fast.[6][16]
Security Signal Strength
A lot of attacks change timing more than content. Inter-packet arrival time (IAT) was ranked as the top feature for multiclass anomaly detection in healthcare IoT environments.[7]
Here’s why that matters:
- Very regular short flows to unknown external IPs can suggest command-and-control (C2) beaconing.
- Unusually long sessions to unapproved endpoints can point to data exfiltration.
- When teams combine IAT shifts with flow duration changes and other flow features, such as packet size, they get a stronger signal and fewer false positives.[13][7]
When cadence changes show up across multiple devices, the first place to look is the network.
Incident Triage Value
If many devices change cadence at the same time, treat it as a network-level problem first.[13][15] Flow-based intrusion detection systems such as IoT-FIDS can flag timing anomalies in near real time.[15] Centralized device inventories, vendor-documented communication patterns, and risk profiles help teams sort out whether the anomaly involves a high-risk vendor or a device that handles PHI, then send the case to the right team fast.
3. Idle Time and Sleep Behavior
Many healthcare IoT devices run on a pretty regular rhythm: active for a while, quiet for a while. So when a device drifts from that pattern outside planned clinical-use windows, that change deserves attention. Sleep behavior isn't just an operations metric. It's also an anomaly signal that works alongside flow volume and cadence. When a device is supposed to be quiet, sleep drift is often the first clue that something's off.
Baseline Deviation Severity
A strong baseline shows each device's normal duty cycle: how long it sleeps, how often it wakes, and what idle behavior looks like during off-hours. From there, teams can assign severity tiers for problems like:
- sustained drift from the normal sleep pattern
- repeated wake events outside maintenance windows
- idle periods that disappear completely
That makes it easier to tell the difference between a one-off blip and a pattern that needs action.
Patient Safety Impact
Abnormal sleep behavior doesn't just point to a security issue. It can affect care in direct ways. If a device misses a scheduled wake cycle, it may skip a monitoring interval or delay an alarm. If it never enters sleep mode, it can face thermal stress and faster component wear, which increases the chance of an unexpected failure during use.
The highest-risk group includes life-support, medication delivery, and continuous monitoring devices.
Security Signal Strength
Sleep anomalies matter because attackers often try to blend in during quiet periods. That means activity during expected sleep windows can be a strong warning sign. High-confidence indicators of compromise include:
- unexpected outbound traffic during sleep windows
- frequent unscheduled wake events
- a CPU that stays fully active when only low-power mode should be running
In plain terms, if a device is acting busy when it should be resting, that deserves a close look.
Incident Triage Value
It helps to split sleep anomalies by impact: safety issues go to biomedical engineering, while security issues go to the SOC. Safety-related anomalies, such as missed scheduled wake cycles or repeated unresponsiveness, should go to biomedical engineering and clinical operations. Security-related anomalies, such as continuous overnight activity or repeated wake events tied to failed logins, should go to the cybersecurity or SOC team.
Automated ticket enrichment can speed up routing. Include details like device model, clinical location, PHI exposure, and vendor risk profile so the right team gets the right issue without delay.
4. Remote Endpoints and Port Usage
Healthcare IoT devices usually connect to the same servers on the same ports. So when the destination changes, or the protocol shifts, that deserves a closer look. Endpoint and port monitoring is one of the most direct ways to catch unauthorized connections and protocol drift. Sometimes the traffic volume and timing look normal. The odd part is where the device is talking.
Baseline Deviation Severity
Use the baseline to separate approved clinical traffic from everything else. A good baseline should document approved destinations, ports, protocols, and traffic direction.
For example, an infusion pump reaching an unknown external IP over port 445 or 3389 is high risk. That kind of traffic stands out right away. Score these deviations based on endpoint reputation, port risk, and device criticality.
Patient Safety Impact
Unauthorized connections can change device settings, disable alarms, or interrupt imaging and other care-critical systems. In places like the ICU, OR, and ED, even a short outage can have serious effects.
Security Signal Strength
Endpoint drift often shows what flow volume alone misses. Remote endpoint and port telemetry is a strong signal because medical devices tend to communicate with a fixed set of destinations and ports.
Common attack methods like data exfiltration, lateral movement, and command-and-control often depend on new endpoints or new ports. So if a device suddenly starts using Telnet (23), FTP (21), or SMB (445) when its baseline shows only HTTPS traffic, that's a direct sign of protocol misuse or exploitation.
It also helps to compare the device against the rest of the fleet. If one pump reaches an unknown domain over port 8080 and the rest do not, isolate that device first.
Incident Triage Value
When an endpoint or port alert fires, the triage team needs context fast. Logging should capture:
- Device ID
- Clinical location
- Destination IP and DNS name
- Port and protocol
- Data volume
- Timestamp
With that data, a Tier 1 analyst can quickly check whether the traffic matches a documented change request. If it doesn't, the SOC can restrict the traffic through a firewall or ACL while the biomedical engineering team checks with the vendor.
Platforms like Censinet RiskOps™ can centralize approved data flow records, which helps analysts confirm whether a connection is expected without taking the device offline unless they have to.
5. Online/Offline Status and Reconnection Attempts
After cadence, check availability. The key question is simple: does the device stay online when it should? If a device keeps dropping off and reconnecting, treat that as a signal, not background noise. That kind of connectivity drift can point to interference, setup issues, hardware failure, or tampering.
Baseline Deviation Severity
Availability baselines should fit the device’s role, location, and mobility. Set those baselines by device class.
A bedside ICU monitor should stay online during active use. A mobile ultrasound, on the other hand, may go offline during transport or while sitting in storage. So the same outage doesn’t mean the same thing across every device. Look at outage length and reconnect frequency against the right baseline for that class.
Patient Safety Impact
Connectivity losses can slow care. Monitors may lose alarm coverage, and pumps may miss safety updates or drug-library changes.
Security Signal Strength
When drops cluster around the same model or the same location, that can point to interference, network setup issues, or tampering. Reconnect loops mean more when they show up alongside failed logins and management access. In plain terms, correlate reconnect loops with login and management activity before escalating. That gives you a stronger case for compromise.
Incident Triage Value
For triage, log the details that help biomedical and security teams route the alert fast:
- Device ID
- Location
- SSID or VLAN
- Timestamp
- Outage length
- Reconnect count
If connectivity stays stable, check latency and response time next.
6. Network Latency and Response Time
Once uptime checks out, the next thing to look at is speed. Latency is how long a packet takes to travel. Response time is the gap between data being generated and that data turning into usable output. Put simply, these two numbers tell you if a device is keeping pace with clinical work - or holding up data when time matters.
Baseline Deviation Severity
You should set baselines by device class and network location. A bedside monitor sending continuous telemetry over the hospital LAN may have a normal round-trip time of 20–50 ms. A cloud-connected device may sit closer to 80–150 ms because WAN routing and encryption add delay.
When latency drifts from baseline, look at both the size of the jump and how long it lasts.
- Low: Up to 2× baseline for less than 10 minutes - log for trend analysis
- Medium: 2–3× baseline or more than 200 ms (LAN) for 10–30 minutes - check for congestion or misconfiguration
- High: More than 3× baseline or more than 300–500 ms (real-time devices) for more than 30 minutes - escalate at once
For devices tied to continuous monitoring - like ICU monitors, ventilators, and infusion pumps - use shorter detection windows of 1–5 minutes. For lower-risk IoT devices, such as storage temperature sensors, 15–60 minutes usually makes more sense.
Patient Safety Impact
For cardiac monitors, even a 10–30 second delay in alarm delivery during a life-threatening event can slow the clinical response. That’s not a minor lag. In a bad moment, those seconds can feel painfully long.
Security Signal Strength
A broad, even rise in latency often points to congestion. But if one device starts spiking while also showing unusual outbound traffic or failed login attempts, that’s a different story and should trigger a security review. That split matters because it tells you whether the issue stays with operations or needs to move to security.
Incident Triage Value
When a latency alert fires, start with life-support devices and high-acuity monitoring equipment. If the alert shows up alongside other signals - failed logins, new remote endpoints, or managing threats to patient care through vendor incident notices - it should be escalated, not pushed aside.
7. Packet Loss and Retransmission Rate
After latency, look at whether packets are being lost or sent again. Packet loss means packets never arrive. Retransmission rate shows how often the network has to resend them. Latency tells you about delay. Packet loss tells you about missing data. That gap matters in anomaly detection because a device can show acceptable latency while quietly dropping packets in the background. If you’re not watching the right metrics, that kind of drift can slip by.
Baseline Deviation Severity
On stable wired or enterprise Wi‑Fi networks, packet loss should stay close to 0% during steady-state operations. You may still see short spikes in the 0.1–0.5% range during congestion or maintenance windows. Baseline TCP retransmission rates usually remain below 0.5–1% of total packets under normal load.[19]
If those numbers climb or stay high, the severity depends on two things: how long the change lasts and which devices it affects.
| Severity | Packet Loss | Retransmission Rate | Duration | Action |
|---|---|---|---|---|
| Low | 0.2–0.5% | 0.5–1% | 15–30 min (log trend) | Log |
| Warning | 1–2% | 2–3% | 10–15 min (check QoS) | Investigate |
| Critical | >2–3% | >3–5% | Sustained | Escalate |
For real-time monitoring devices, set a tighter warning threshold at >0.5% loss. Non-real-time systems, such as imaging archives, can handle somewhat higher levels before an alert makes sense.
Patient Safety Impact
The clinical risk changes based on how time-sensitive the device’s data and commands are. With continuous monitoring devices like cardiac telemetry and pulse oximetry, packet loss above 1–2% can lead to delayed or missing vital sign updates. That increases the chance of missed deterioration trends or delayed alarm annunciation.[20]
For infusion pumps, even moderate retransmissions can interrupt dose library updates or event logging. That can make post-incident review much harder. For life-support devices like ventilators, repeated loss on monitoring or control channels should be escalated fast.
Security Signal Strength
Missing packets don’t always mean a plain network issue. Sudden, localized loss can point to RF jamming, ARP spoofing, or rogue access points, especially when it appears alongside failed logins or unusual outbound traffic.[17][18] If the loss continues, the next step is to check wireless signal quality and noise.
Incident Triage Value
Send alerts based on device criticality. If loss affects life-support or continuous monitoring devices in the ICU, OR, or ED, it should land in a high-severity queue and trigger on-call notification if it lasts more than 3–5 minutes. For non-real-time infrastructure, review alerts during normal hours unless the loss is spreading or getting worse.
Censinet RiskOps™ can enrich alerts with vendor, model, location, PHI exposure, and risk rating, so the right team gets the right context fast. When packet loss sticks to mobile devices, signal and interference problems are often the cause.
8. Signal Strength and Signal-to-Noise Ratio
When packet loss starts clustering on mobile devices, signal strength and SNR are often the first places to look. They tell you whether the problem starts in the RF layer or somewhere else.
Signal strength (RSSI) shows how well a device receives a wireless signal. SNR - or CNR in telemetry - shows how far that signal sits above background noise. That difference matters. A device can still see a signal, but if noise is crowding it, performance can fall apart fast.
Baseline Deviation Severity
Baselines need to match the setting. Device type, model, location, and time of day all matter because RF conditions shift across floors, wings, and room layouts. A monitor in a hallway may behave one way at noon and another way overnight. That’s normal. What matters is spotting drift from that device’s usual pattern.
For wireless medical telemetry, a CNR of at least 15–20 dB is needed for minimum reception, and manufacturers generally recommend CNR ≥30 dB for strong operation.[24] For Wi‑Fi devices, keep signal quality above 60% before the adjacent access point and above 30% after it to avoid disconnection.[23]
| Severity | Pattern | Scope | Action |
|---|---|---|---|
| Low | Brief dip during transport | Single device, short-lived | Log |
| Warning | Persistent deviation from baseline in one area | One or a few fixed-location devices | Investigate placement and nearby interference |
| Critical | Sustained loss or repeated reconnects | Multiple devices in the same zone | Escalate immediately |
A brief dip during transport usually isn’t a crisis. A fixed device that keeps drifting from baseline in one area is more telling. And when several devices in the same zone show sustained loss or repeated reconnects, that’s the kind of pattern you don’t sit on.
Patient Safety Impact
Weak or noisy wireless links can delay alarms, break telemetry trends, and interrupt commands. In a care setting, that’s not just an IT problem. It can change what clinicians see and when they see it.
One study found that wireless devices placed within about 1 foot of life-support equipment caused glitches in nearly 30% of tests and hazardous malfunctions in about 20%.[25] That’s a blunt reminder that RF problems can move from annoying to dangerous very fast.
Security Signal Strength
Signal trouble isn’t always a coverage issue. Sometimes it points to interference, and sometimes that interference may be intentional.
Sudden, localized signal degradation across multiple devices can point to interference or a rogue RF source. A sudden, localized drop in SNR with unchanged RSSI can suggest a high-power interferer rather than a coverage gap.[21][22][24] If the same pattern keeps showing up in one zone or during the same time window, it may indicate an unauthorized RF device or rogue access point.
That kind of event should be treated like a possible security incident, especially when it lines up with authentication failures or unusual reconnect activity.
Incident Triage Value
The first triage question is simple: Is this isolated or widespread?
A single device with poor signal usually points to placement, antenna, or hardware trouble. Multiple devices failing at the same time in the same area usually point to interference, a facilities change, or deliberate disruption.
A practical path looks like this:
- Route isolated issues to network or biomedical engineering
- If the pattern is abrupt, localized, and unrelated to facility work, bring in security
- If signal quality looks stable, check CPU and memory next to see whether the device itself is under strain
That flow helps separate RF trouble from device-side stress before the case starts bouncing between teams.
9. CPU Utilization
After network traffic and wireless quality, CPU shows whether the device itself is under strain. CPU utilization tells you how hard a device's processor is working at a given moment. When that number climbs and there's no clear clinical reason for it, that's a signal worth checking.
For many embedded medical devices, normal CPU load falls in the 10–40% range, with short, expected spikes during known tasks like data encryption, EHR data transmission, or image processing. In live deployments, steady-state averages can be even lower. One IoMT gateway study recorded an average CPU utilization of just 9.2% during normal operation, with peaks up to 30%.[26] On the other hand, sustained 80–90% CPU while the device is idle can point to malware, a logging loop, or a misconfigured agent.
Baseline Deviation Severity
Once you have a baseline, sustained CPU drift starts to mean something. Here's a practical starting point:
| Severity | Pattern | Device Type | Action |
|---|---|---|---|
| Low | 10–20% above baseline, short-lived | Any | Log and monitor |
| Warning | 20–40% above baseline, sustained >15–30 min | Non-critical | Investigate recent changes or updates |
| Critical | >40% above baseline or repeated near-100% spikes | Life-support or patient-connected | Escalate immediately |
Context matters a lot here. On a ventilator or infusion pump, even a moderate sustained deviation should be treated as high severity. The same spike on a non-critical device, like a lab label printer, carries much less risk.
Patient Safety Impact
High CPU can slow alarms and control actions. If a background task starts eating processor time, a patient monitor's alarm evaluation algorithms may run less often. That can delay arrhythmia detection or slow the escalation of dangerous vital sign changes. An infusion pump with an overloaded processor may lag during dose adjustments or freeze outright, forcing staff to step in manually. In ICUs and operating rooms, that kind of delay isn't academic - it hits right away.
Security Signal Strength
Unexplained CPU activity is a strong security signal on medical devices. Malware, cryptomining software, and botnet agents all burn processor cycles, often in patterns that don't match normal clinical use. Watch for:
- Sustained high CPU with no active clinical use
- Spikes that line up with unusual outbound connections
- Load increases that show up soon after a software update or external storage was connected
CPU telemetry is a useful malware signal on embedded devices, where major deviations from known patterns can trigger security alerts.[27] Pairing CPU telemetry with network monitoring makes that signal much stronger.
Incident Triage Value
Start by asking whether the spike is isolated or widespread. One device with high CPU often points to a software bug, a misconfiguration, or a local compromise. A group of identical devices showing the same pattern can suggest a faulty firmware batch or a targeted attack.
Give top priority to alerts where high CPU shows up alongside active patient connections, alarm floods, or authentication failures. Those combinations call for immediate escalation. If the pattern repeats across devices, check firmware and configuration changes first.
If CPU stays high, check memory next for leaks or runaway processes.
10. Memory Usage and Leak Patterns
Memory usage tells you if a process is slowly eating up RAM over time. A leak usually looks like steady growth that doesn’t drop back to baseline after a task finishes. If CPU is running hot, memory is often the next place to check.
Keep an eye on memory over time for leaks and excess caching. Both can push up latency, cause disconnects, and make monitoring less dependable. The main pattern to watch for is simple: memory keeps climbing for hours or days even though workload hasn’t increased.[28]
Baseline Deviation Severity
Set baselines by device model and firmware version. That matters because even small software changes can shift what “normal” looks like. Once those baselines are in place, deviations start to mean something.
| Severity | Pattern | Action |
|---|---|---|
| Low | 10–20% above baseline for less than 30 minutes during known high-load events; returns to normal | Log and monitor |
| Medium | 20–40% above baseline for several hours without clear workload justification, or repeated spikes that recover but occur more than 5–10 times per day | Investigate recent updates or configuration changes |
| High | >40–50% above baseline, sustained for 6–12 hours, or free RAM under 10–15% | Escalate immediately, especially on life-critical devices |
One IoT anomaly monitoring framework treats continuously rising memory use as a clear anomaly condition. That’s even more concerning when utilization sits near 95% for long stretches while normal peaks are closer to 40%.[30]
Patient Safety Impact
Memory leaks can drain RAM until the device hangs, reboots, or slows alarms. On life-support and continuous-monitoring devices, that’s not just an IT problem. It can become a patient safety issue fast.
Security Signal Strength
A memory anomaly can point to a software defect or a compromise. The shape of the pattern often gives you the clue. Leaks tend to climb slowly. Malicious processes often appear as sudden jumps, especially when they line up with odd outbound traffic or activity outside normal hours.[29]
Treat any unknown process using significant RAM as a high-priority security signal, not just a performance issue.
Incident Triage Value
Once you’ve confirmed a memory anomaly, send it to the right team based on impact and likely cause. Memory alerts should be ranked by device criticality, size of deviation, and any linked security signals.
If the anomaly lines up with signs of compromise, cybersecurity should take the lead. If it looks more like a software defect or uptime problem, clinical engineering should own the first response. Censinet RiskOps™ can add vendor risk and device criticality to these alerts, which helps teams assign ownership faster and move sooner.
11. Storage Utilization and Log Growth
After memory, check storage next. Full disks and missing logs often show up before a device fails. On healthcare IoT devices, storage use and log growth can point to three risks: hidden data staging, logging being shut down, and disks getting close to full.
Normal storage use usually lands around 40% to 60% of disk capacity and follows the device’s usual daily log pattern. That pattern matters. A radiology system produces far more data than a bedside vital signs monitor, so using the same threshold for both will lead to noisy alerts that you can’t trust.
Pay close attention to fast, unexplained disk growth. If a device jumps from 50% to 85%–90% utilization within 24–48 hours without any rise in clinical activity, that’s a red flag. It can mean data is being staged locally before exfiltration, with an attacker collecting PHI on the device before moving it elsewhere. The opposite pattern matters too: logs that suddenly drop off or go flat while the device is still active. That can point to logging suppression through truncation, aggressive rotation, or logging being turned off altogether. In both cases, the problem isn’t just device slowdown. These patterns can also hide evidence.
When local storage fills completely, devices often overwrite old logs so they can keep running.[34] That destroys forensic evidence. In healthcare, missing logs during ransomware incidents have stopped organizations from figuring out how the attack began and how far it spread.[31][32][33] FDA and NIST guidance now treat event logging and log retention as direct design requirements, not optional add-ons.[35][36][2]
Baseline Deviation Severity
| Severity | Pattern | Action |
|---|---|---|
| Low | 10–20% above baseline disk usage or log growth; stable trend; no clinical impact | Log and monitor |
| Medium | 20–40% above baseline, or sustained abnormal growth over several days | Investigate for misconfiguration or unusual activity |
| High | >40% above baseline, disk above 80–85%, or doubling in 12–24 hours | Escalate immediately; initiate log archival or cleanup |
For devices that handle time-sensitive clinical data, such as infusion pumps, continuous monitors, and imaging systems, set tighter alert thresholds. A medium alert at 70% disk utilization instead of 80% gives the team more time to respond before the device starts to degrade.
Patient Safety Impact
Storage exhaustion is not just an IT capacity problem. If a radiology modality runs out of disk space, it may fail to save or send new imaging studies, which can delay diagnosis. If a bedside monitor can’t write new data, gaps can appear in vital sign histories that clinicians rely on. And if a device stops logging alarms or parameter changes, post-incident review becomes far harder. These are known failure modes, and they can slow care.
Security Signal Strength
Odd storage behavior is a strong security signal, especially when it lines up with other anomalies. A device holding far more data than its baseline, especially near external interfaces, should be treated as high risk. Also look for newly created compressed archives like .zip or .tar in non-standard directories, or debug logging that was never planned through a maintenance ticket. Strange retention patterns often show up before exfiltration attempts.[34]
Incident Triage Value
Give priority to storage spikes on high-criticality devices, especially when they appear alongside failed log writes or authentication anomalies. Used with network and authentication signals, storage anomalies help teams sort routine buildup from an active compromise.
12. Operating Temperature and Power Draw
Operating temperature and power draw can tell you a lot. They point to hardware strain, room or placement issues, and odd processing behavior. The key is to watch the pattern over time, not just a single reading.
Start by building a baseline for each device from its own past data. Use periods with normal workload, normal room temperature, charging status, wireless use, and operating mode. That way, you're comparing the device to itself, not to some generic benchmark.
When you need to triage an abnormal pattern, group the likely causes like this:
- Environmental: blocked vents, placement near heat sources, or weak airflow in a cabinet or cart
- Hardware: battery wear, failing cooling parts, or thermal runaway in lithium-ion batteries
- Security-related: unexpected background activity or attack traffic
Attack-driven power spikes can push energy use and processor load up fast. That makes heat and power useful anomaly signals, especially when the change shows up out of nowhere.
Baseline Deviation Severity
| Severity | Pattern | Action |
|---|---|---|
| Low | Slight temperature rise during expected activity or a small power change | Log and monitor; check environmental conditions |
| Medium | Sustained warmth during idle periods or rising power draw without a workload change | Investigate for hardware fault, firmware regression, or environmental cause |
| High | Rapid temperature spike, repeated thermal cycling, overheating during off-hours, or battery drain that accelerates while usage stays flat | Escalate immediately; pull the device from service if patient safety is at risk |
Patient Safety Impact
Too much heat wears down battery life, triggers throttling, and can force shutdowns. On patient-facing devices, that can lead to missed readings, delayed alarms, or gaps in monitoring during active care. In a care setting, that's not just a device issue. It can become a patient issue fast.
Security Signal Strength
Temperature and power anomalies become a stronger security signal when workload or room conditions don't explain them. If a device stays warm and power-hungry overnight with no scheduled tasks running, that's worth a closer look.
These signals matter most when they show up alongside network, authentication, or CPU changes. Thermal and power data on their own rarely confirm a compromise. But when you pair them with network and authentication telemetry, they can help narrow the cause much faster.
Incident Triage Value
If temperature or power climbs without a clear operational reason, first check room conditions, ventilation, and any recent firmware changes. If those look normal, compare the device to its own historical baseline and to similar devices across the fleet.
A few patterns can point you in the right direction:
- A single outlier after a software push often points to a regression
- The same pattern across one ward often points to an environmental issue
- One device acting strangely with no room or software trigger deserves security review
From there, send alerts to biomedical engineering, facilities, or security operations based on the root cause that looks most likely.
13. Authentication Failures and Access Attempts
Authentication failures are often one of the first signs that something is off. One bad password entry is just noise. But a wave of failed logins across many accounts on the same device - especially at 2:00 a.m. on a Sunday - deserves attention. That matters even more when the activity involves privileged or service accounts.
What should you track? Not just the number of failed logins. The better view includes:
- The ratio of failed attempts to successful ones
- The source IP and network origin
- Which accounts are being targeted
- Whether the attempts involve privileged or service accounts that systems usually use, not people
- The time-of-day and day-of-week pattern
Attempts against disabled or deprovisioned accounts are an especially strong warning sign. Those events often point to credential stuffing or insider misuse, not a simple typing error.
Baseline Deviation Severity
A normal access baseline helps sort routine use from suspicious behavior. A bedside monitor used by day-shift nurses has a very different pattern from an imaging console used by rotating technicians. Once that baseline is in place, outliers are much easier to judge.
| Severity | Pattern | Action |
|---|---|---|
| Low | Slight uptick in failures within historical range (e.g., after a password policy rollout) | Log and monitor; correlate with known change events |
| Medium | Clear spike from a single internal workstation or user account | Verify source, check for misconfigured credentials or onboarding activity |
| High | High-rate failures across multiple accounts or devices, especially from external IPs or unmanaged segments | Escalate immediately to security and clinical engineering; consider blocking the source or isolating the device |
Repeated failed logins on a life-support device call for a faster response than the same pattern on a nonclinical terminal.
Patient Safety Impact
Abnormal authentication activity is not just a security issue. It can affect care in direct ways. Repeated failures can lock clinicians out of ventilators, infusion pumps, or patient monitors. If an attacker does get in, they may be able to change infusion rates, alarm thresholds, or monitoring status.
Even when no one breaks in, constant login trouble can push staff toward unsafe workarounds, like sharing credentials. That chips away at accountability and opens the door to more risk.
Security Signal Strength
The signal gets stronger when the attempts follow familiar attack patterns: cycling through usernames, incrementing passwords, or hitting the same privileged functions again and again. IP ranges that should never touch on-premises medical device gateways are another high-confidence sign.
The same goes for authentication events tied to service or machine accounts that systems usually use on their own, not people - especially outside maintenance windows. To sort weak signals from serious ones, line these anomalies up with other telemetry:
- Unusual flow volume
- CPU spikes
- Remote endpoint changes
That kind of correlation helps sharpen the picture before escalation. It also makes network and endpoint metrics much more useful in triage.
Incident Triage Value
On life-support and patient-facing devices, even short access issues can affect care. When authentication anomalies appear, start with context. Did a password policy change go out recently? Is a new device rollout in progress? Are staff being onboarded?
Benign spikes usually match known events and come from recognized internal subnets. Suspicious activity tends to show up outside change windows, build over time, and come from places that do not fit normal access patterns.
Triage should include validating the source IP, checking whether the targeted account type matches the device’s normal access profile, and confirming with clinical engineering before taking any containment step that might affect patient care. Platforms like Censinet RiskOps™ can help connect authentication anomalies to broader device risk profiles, including PHI exposure, known vulnerabilities, and vendor risk, so triage decisions are based on the context that matters most. If access behavior looks clean, the next step is firmware and update behavior.
14. Firmware Version and Update Behavior
Track each device’s approved firmware version, build number, signature status, and update cadence. Any version drift - newer than approved, older than approved, unknown, unsigned, or off-schedule - needs review. The main question isn’t just what version is installed. It’s also how it got there and when it changed.
Baseline Deviation Severity
A firmware mismatch is a high-confidence signal because version numbers are usually easy to check against approved inventory. That matters for two reasons: security and bedside performance.
| Signal | What It May Indicate | Priority |
|---|---|---|
| Older-than-approved version | Missed patching or unsupported device | Review |
| Unexpected newer version | Unapproved change or possible tampering | High |
| Failed signature check | Altered or malicious firmware image | Escalate immediately |
| Repeated update retries or loops | Installation failure or unstable device | Medium |
| Backup or recovery mode after update | Update complication affecting device function | Check clinical impact immediately |
Patient Safety Impact
Outdated firmware can leave known vulnerabilities in place and interfere with alarms, communications, and interoperability. In a hospital, that’s not a minor IT issue. It can affect how a device behaves when staff need it most.
A clear example came in 2017, when a pacemaker firmware update affected about 465,000 implanted devices after cybersecurity vulnerabilities were identified.[37][38]
Security Signal Strength
Version alone doesn’t tell the whole story. A device can report the expected version and still be compromised if the update path itself was tampered with. That’s where digital signature validation and integrity checks matter.
A failed signature check - even on a device that shows a familiar version string - should be treated as a high-confidence sign of tampering. The same goes for cases like these:
- Updates delivered from an unapproved server
- Rollback events with no change-control record
- Devices that update without issue, then start failing integrity checks or show altered network behavior
Incident Triage Value
When a firmware anomaly appears, start with a plain question: Was this change authorized? Compare it against the change-control record, the approved maintenance window, and vendor guidance. Routine updates should match a documented schedule and an approved device group.
Off-schedule version jumps, one-off changes on locked-down devices, or updates followed by unexpected reboots and service restarts all need a closer look. After any patch, run post-update functional checks to confirm the device restarts normally, reconnects as expected, and resumes normal telemetry.[39]
If the update also triggers repeated reboots or startup errors, move to the next metric.
15. Error Codes, Reboots, and Startup Anomalies
After firmware changes, startup behavior is often the fastest way to spot trouble. Unexpected error codes, reboots, and odd startup behavior can point to hardware issues, software bugs, or compromise. The key is to track whether the event is isolated or keeps happening. Look at reboot timing, error frequency, and the startup sequence together - not one by one.
Baseline Deviation Severity
Set device-specific baselines for reboots and errors. A pump in active use should almost never reboot. A monitor, on the other hand, may reboot during planned maintenance. Compare reboot rate, error rate, and startup timing against each device’s normal maintenance and usage cycle.
| Signal | What It May Indicate | Priority |
|---|---|---|
| Reboot frequency rises above the expected baseline | Software instability or hardware fault | High |
| Repeated reboots in a short window | Possible boot loop or fail-state entry | Escalate |
| Error codes that lock the device until recovery | Software design flaw or hardware defect | High |
| Boot time is slower than baseline | Firmware issue or degraded hardware | Review |
| Missing startup steps, such as skipped security-module initialization | Possible tampering or corrupted firmware | Escalate immediately |
Repeated reboots can push a device into fail-safe states, lockouts, or factory resets. That’s why a short burst of restarts can matter just as much as a single major fault.
Patient Safety Impact
A reboot might leave core therapy untouched but still disrupt monitoring or user input. That may sound minor on paper, but at the bedside, even a short interruption can create risk. Any event that interrupts active therapy should get the highest priority.
That applies to infusion pumps during delivery, ventilators in the ICU, and anesthesia machines in the OR. A Fresenius Kabi Ivenix Large Volume Pump software issue led to a Class I recall because unexpected shutdowns and interface freezing could interrupt infusion therapy, with two serious injuries reported.[40]
Security Signal Strength
If the firmware appears correct but startup behavior doesn’t match, treat the device as suspect. Failed secure boot, skipped security-agent initialization, repeated authentication failures, firmware integrity failures, or reboots soon after network connection all deserve review.
Startup anomalies carry more weight when they show up alongside other warning signs, such as:
- Failed logins
- Odd network traffic
- Altered boot order
The same error pattern across several devices at the same time is a much stronger risk signal than a one-off event on a single unit.
Incident Triage Value
Capture error codes with full context. That means the error identifier, timestamp, affected subsystem, operating mode, whether the device is in use, and its power or battery state. Without that context, the code alone may not tell you much.
It also helps to separate errors that lock the device from transient errors that clear on their own. Those two cases call for very different responses. Send reliability issues to clinical engineering and route security-related anomalies to cybersecurity, then use care area, device criticality, and active patient use to decide urgency.
Normal vs. Abnormal Device Behavior: A Quick Reference
The table below turns the earlier metrics into a fast triage cheat sheet. Think of it as a pattern guide, not a hard rulebook. Use 30- to 90-day baselines to set your own internal thresholds.
| Device Class | Metric | Normal | Abnormal | Cause | First Action |
|---|---|---|---|---|---|
| Patient Monitor | Flow volume / data rate | Steady low outbound traffic to the monitoring server | Sustained Mbps-level jump without clinical reason | Data exfiltration, misconfiguration, or device loop | Security: verify endpoint allowlist |
| Patient Monitor | Remote endpoints / ports | Monitoring servers, NTP, approved vendor VPN | Traffic to unknown external IPs or unexpected ports (e.g., outbound SMB/445) | Malware or VPN misconfiguration | Isolate to restricted VLAN; verify against allowlist |
| Patient Monitor | Authentication failures | Low, stable count tied to known events | Spike to 3–5× daily baseline outside business hours | Credential brute forcing or misconfigured 802.1X | Security: investigate source accounts; escalate if pattern spans multiple units |
| Infusion Pump | Online/offline status | Stable Wi-Fi; reconnections tied to maintenance or power cycles | Repeated flapping between access points or reconnection loops | RF interference, WLAN misconfiguration, or failing NIC | Network and Clinical Engineering: review wireless controller logs |
| Infusion Pump | Authentication failures | Pre-provisioned certificates; interactive logins extremely rare | High failure rate from non-standard accounts or at unusual hours | Credential brute forcing or misconfigured RADIUS | Safety first: do not interrupt active infusions; Security: investigate failed auth sources |
| Infusion Pump | Error codes / reboots | Reboots during scheduled maintenance or between patient uses | Multiple daily reboots unrelated to maintenance; errors correlate with network events | Corrupted firmware, failing components, or exploitation | Biomed and Security: hash-check firmware integrity; escalate to manufacturer if compromise suspected |
| Imaging System | Flow volume / data rate | High but episodic outbound bursts to PACS/VNA during image upload | Persistent outbound traffic to non-PACS destinations after hours | Exfiltration, unauthorized remote backup, or cloud sync misconfiguration | Security: isolate external access; preserve logs |
| Imaging System | CPU / memory usage | High during acquisition and reconstruction; stable afterward | CPU pegged near 100% and memory trending upward with no scans running | Malware, cryptomining, or runaway process | Security: check for unauthorized processes; Clinical Engineering: coordinate with radiology |
| Imaging System | Storage / log growth | Predictable growth based on study volume; logs rotate per vendor config | Logs balloon over hours rather than weeks; disk fills unexpectedly | Recurrent error, debug logging left on, or malware artifacts | IT: verify log rotation; Security: check for debug flags and unauthorized write activity |
For mission-critical devices like infusion pumps, the network setup should usually include isolated VLANs and tightly restricted outbound access. In that kind of setup, any outbound traffic to an external destination is a strong sign of possible exfiltration or compromise.[41]
There’s also a pattern worth watching for: when the same anomaly shows up across multiple devices in the same class, don’t treat it like a one-off glitch. That usually points to a shared network or firmware issue, not a fault in just one device.
Use the table to sort alerts by device class, then move the highest-impact cases to the front of the line.
How to Prioritize Alerts Without Overloading Your Teams
When your metrics spot an anomaly, the next step is deciding what needs attention first. The point is NOT to chase every alert at once. It’s to handle the right alerts first.
A simple way to do that is to score each alert across four areas: patient safety impact, likelihood of exploitation, device criticality, and known vulnerability exposure.[3][43][44][45] Use a 1–5 score for each one, and give the most weight to patient safety. That one choice can keep teams focused on what matters most. For example, the same odd behavior on a ventilator or infusion pump should rank far above that behavior on an isolated, low-criticality sensor.
That scoring model works much better when you add asset context. On their own, behavioral signals can be noisy. Once you attach details like device type, firmware, clinical role, PHI exposure, owner, and support status, the alert starts to mean something. Network segmentation matters too. A device that can route to EHR or medication systems should move up the queue much faster than the same device sitting on an isolated guest network.[42][46]
Routing matters just as much as scoring. If an alert lands in a queue with no clear owner, it can sit there far too long. Ownership data fixes that. Every high-priority alert should show the clinical owner, the technical owner, and the right vendor contact or support contract right away. Then there’s no guessing about who checks impact, who approves containment, or who calls the vendor.
Tools like Censinet RiskOps™ can help pull this context into one place. They can link device alerts to vendor risk scores, past assessment findings, PHI exposure, and documented security gaps, so the alerts that matter most move to the top with the needed context already attached.
To keep alert volume from getting out of hand, bundle repeated low-severity alerts into periodic summaries. Tune thresholds using past data so routine, harmless deviations stay quiet while combined risk signals still stand out. It also helps to build a feedback loop where analysts can mark false positives and tighten detection logic over time. Suppression rules need regular review too, because workflows change and yesterday’s normal can turn into today’s blind spot.
Final Thoughts
When you put these metrics together, scattered telemetry starts to look like a usable picture of device behavior. Good IoT behavior monitoring in healthcare is not about collecting every single data point. It’s about tracking the right metrics and knowing what to do with them. The payoff comes from connecting behavior, performance, and change.
Baselines are what make anomaly detection matter. Models and thresholds only help after normal behavior has been defined.[1]
That’s also why thresholds by themselves don’t go far enough. Clinical context is what separates a true anomaly from routine variation. The same signal might be normal or abnormal based on the device, the ward, and the time of day. Keep alerts tied to that context, and the monitoring program stays useful instead of noisy.
Platforms like Censinet RiskOps™ help by linking device telemetry with vendor risk history, PHI exposure, and clinical context. When telemetry, risk history, and clinical context sit together, alerts become easier to act on. The aim is simple: faster detection, clearer triage, and less noise.
Build baselines, apply context, score risk, and keep refining.
FAQs
How do I build a baseline for IoT device behavior?
Start with a full inventory for each device. Include the manufacturer, model, OS version, MAC address, network segment, and clinical purpose.
Then use passive network monitoring to gather telemetry. Focus on details like protocols, endpoints, data volumes, and session timing.
Watch each device class during normal operation. Leave out maintenance windows and known incidents so the data reflects day-to-day use.
After that, review the findings with clinical and biomedical teams. This helps set accurate anomaly thresholds for each device type instead of using one blanket rule for everything.
Which IoT metrics matter most for patient safety?
For patient safety, focus on metrics that connect device behavior to patient care. That means looking beyond raw alert volume and tracking what changes care in practice, including:
- device uptime for critical care availability
- false alert rates after firmware updates
- coverage of critical devices by high-confidence detections
- alerts with clinical context, such as medication delivery or imaging disruptions
- MTTD and MTTR for high-risk assets
How should teams prioritize IoT device alerts?
Teams should use a risk-based approach instead of treating every alert the same way. Start with what matters most: the device’s effect on patient safety and day-to-day operations. Then look at security events alongside performance data and the device’s clinical role.
That changes how triage works in practice. A life-support device needs immediate attention. A lower-risk device, on the other hand, can move through the normal response path.
It also helps to review alerts every month. Those reviews can cut down on false positives and help confirm containment actions with clinical or biomedical sign-off.
