
Manual vendor assessments cost more than most healthcare teams think. If you run 150 to 300 assessments a year, manual work can burn through hundreds of thousands of dollars in labor, slow vendor onboarding by weeks, and leave high-risk findings open far longer than they should.
Here’s the short version:
- I see three core costs in manual assessments: labor, delay, and open risk
- A single assessment can take 30 to 35 hours of team time in some environments
- Manual reviews often cost $2,100 to $2,800 per assessment in direct labor
- At 200 assessments per year, that can reach about $490,000
- Automation can cut review time, shrink backlog, and improve scoring consistency
- In one example, a $60,000 platform produced $108,000 in labor savings and an 80% ROI
- Shorter review cycles also reduce queue volume, exception work, and exposure tied to unresolved findings
If I were making the case to leadership, I’d keep it simple: manual assessments are not just slow; they are expensive to run and expensive to delay. The article ties that case to clear math: cost per assessment, FTE use, turnaround time, backlog size, and economic impact of third-party risk.
Here’s the clearest side-by-side view:
| Metric | Manual | Automated |
|---|---|---|
| Cost per assessment | $900 | $540 |
| Turnaround time | 15 business days | 5 business days |
| Analyst hours | 10 | 6 |
| Manager hours | 1.5 | 0.75 |
| Annual capacity with same team | 300 | 450 |
My takeaway: the math supports automation when assessment volume is high, rework is common, and backlog keeps growing. This piece explains that math in plain terms so you can judge the tradeoff fast.
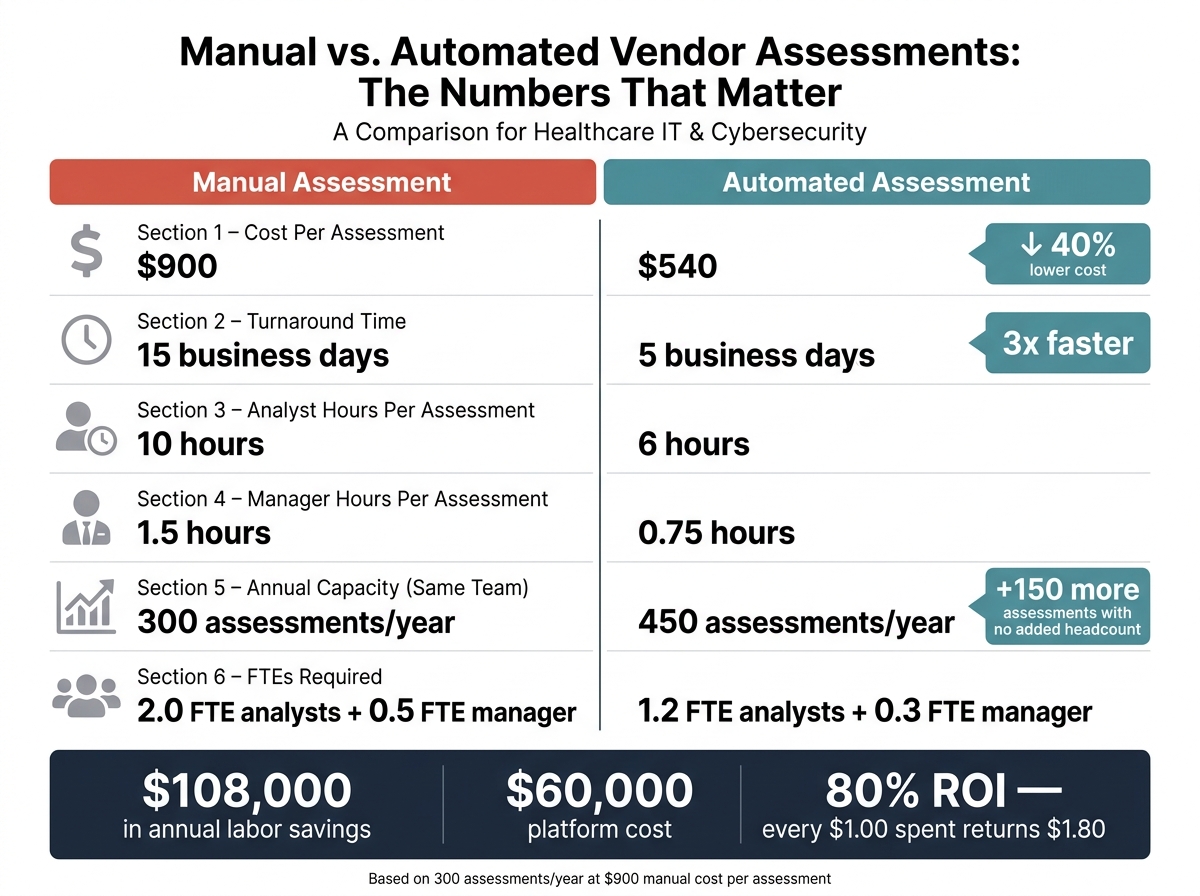
Manual vs. Automated Vendor Assessments: Cost, Time & Capacity
Enhanced Vendor Risk Assessment | Tony Turner
sbb-itb-535baee
The True Cost of One Manual Assessment
One manual assessment comes with a clear labor cost. And that cost sits underneath every backlog, every slow review cycle, and every delayed risk call. If you want to understand the backlog, start with the cost of one file.
Use this role-based formula: Cost per assessment = (analyst hours × analyst rate) + (manager hours × manager rate) + rework. Loaded rates include salary, benefits, taxes, and overhead, usually 1.25x to 1.4x base salary.
Direct Labor: Reviewer Hours, Rework, and Coordination Time
For complex vendors, manual work often includes:
- 4 to 6 hours for review and analysis
- 1 to 3 hours for evidence follow-up
- 1 to 2 hours for stakeholder coordination
- 1 to 2 hours for scoring and documentation
- 1 to 1.5 hours for reporting
Management review adds 1 to 1.5 hours per assessment at $110 to $140 per hour, which increases each assessment by $110 to $210.
Rework adds up fast. At 2 extra hours per assessment and $75 per hour, rework adds $45,000 per year across 300 assessments. At 3 hours, that climbs to $67,500. And every extra hour means findings stay open longer.
Two labeled scenarios show how these inputs change the baseline:
| Scenario A: Mid-Size HDO | Scenario B: Large Health System | |
|---|---|---|
| Analyst loaded rate | $70/hr | $85/hr |
| Analyst hours per assessment | 7 hrs | 10 hrs |
| Manager loaded rate | $120/hr | $130/hr |
| Manager hours per assessment | 1 hr | 1.5 hrs |
| Cost per assessment | $610 | $1,045 |
| Annual volume | 200 assessments | 400 assessments |
| Annual labor cost | $122,000 | $418,000 |
A Simple ROI Formula for Justifying Automation Investment
Once you know the cost per assessment, the case for automation becomes simple math.
ROI = (Annual savings − Annual automation cost) ÷ Annual automation cost
Say manual work costs $900 per assessment across 300 assessments per year. That puts total manual labor cost at $270,000. If automation cuts analyst time by 40% and manager time by 30%, the automated cost per assessment drops to $540, or $162,000 per year.
That creates $108,000 in annual labor savings.
Now subtract an annual automation platform cost of $60,000. The net benefit is $48,000. Using the formula:
ROI = $48,000 ÷ $60,000 = 80%
Put simply, every $1.00 spent returns $1.80 in total value, or $0.80 net.
Manual vs. Automated Assessment: A Side-by-Side Comparison
Using 2,080 working hours per year, the table below shows the FTE effect. The gain isn't just a lower cost per file. It also means the same team can move through more files.
| Metric | Manual Assessment | Automated Assessment |
|---|---|---|
| Cost per assessment (USD) | $900 | $540 |
| Average turnaround time | 15 business days | 5 business days |
| Analyst hours per assessment | 10 hours | 6 hours |
| Manager hours per assessment | 1.5 hours | 0.75 hours |
| Annual assessments handled | 300 | 450 (with the same FTEs) |
| FTEs required | 2.0 FTE analysts + 0.5 FTE manager | 1.2 FTE analysts + 0.3 FTE manager |
With automation, the same team can handle 450 assessments instead of 300 by hand.
Lower cost matters. But shorter cycle time matters just as much. This efficiency is a core part of measuring what matters for cybersecurity in a clinical environment.
The Cost of Delay: Backlog, Exposure, and Missed Deadlines
Lower cost matters. But delay has a way of making everything more expensive.
When assessments move slowly, the damage doesn't stop at the review itself. Cost keeps stacking up every day a case sits in line. Stretch cycle time from 10 days to 25, and the queue starts to swell. Analysts get pulled in too many directions. Teams waiting on approvals sit idle. Work that should move forward just... doesn't.
How Added Cycle Time Turns Into Annual Labor and Queue Costs
At 300 assessments per year across 250 working days, a 25-day cycle leaves about 30 vendors sitting in queue at any given time. Cut that cycle to 10 days, and the queue drops to 12. That's 18 fewer active cases at once. Organizations like Emory Healthcare have seen similar improvements in program scalability.
Those 18 cases aren't just numbers on a dashboard. They can mean delayed onboarding, slower contract review, and later remediation. In a healthcare setting, that hits fast.
If a vendor touches EHRs, PHI systems, or clinical scheduling tools, they usually can't go live until the risk review is done. Legal may have to hold off on finalizing Business Associate Agreements. IT project timelines start slipping. Then security gets stuck doing the extra work nobody plans for, like:
- escalation emails
- status calls
- exception requests
That queue turns into delay across the operation, and it leaves exposure open longer. At $200 per backlogged assessment in added coordination overhead, 18 steady backlog cases create about $3,600 in annual overhead just from sitting in queue. And that's before labor costs or incident risk even enter the picture.
Unresolved Findings Grow More Costly the Longer They Wait
Queue cost is only half the story. Unresolved findings make the risk itself worse.
An open finding isn't passive. It's active exposure. In healthcare, that matters because vendors often touch PHI, clinical workflows, or connected devices. The longer those issues stay open, the more room there is for something to go wrong.
Take a simple scenario: 100 vendors with high-risk findings in a given year. If those findings close within 30 days, incident probability sits at about 2% per vendor. That works out to roughly 2 expected incidents and $6 million in expected loss at $3 million per incident.
Let that remediation drag to 180 days or more, and the math changes fast. Incident probability climbs to 6% per vendor. Now you're looking at 6 expected incidents and $18 million in expected loss. That's a $12 million gap caused by delay alone.
Exception management adds even more cost. Every open high-risk finding needs steady oversight: status tracking, compensating control reviews, and periodic management check-ins. At $100 per hour and 3 hours per month, each unresolved finding costs $300 per month to manage.
Across 100 vendors, a 6-month delay adds up to $1,800 per vendor, or $180,000 in exception overhead.
What Automation Changes: Speed, Consistency, and Risk Reduction
Automation cuts cost by taking repetitive work, uneven routing, and slow handoffs out of the process.
Where Automation Removes Manual Work First
The first savings usually show up where teams are stuck doing the same handoff again and again. AI-driven evidence summarization can summarize vendor documentation fast, so reviewers don't have to go page by page. Automated risk routing sends issues to security, supply chain, and clinical teams without a person acting as the middleman. Automated workflows turn assessments into routed, trackable tasks, which moves teams away from pure data gathering and toward operational resilience.
Every step removed from the manual queue gives analysts time back for the work that needs human judgment.
How Automation Reduces Missed Findings and Repeat Issues
Speed helps. But when findings affect remediation, consistency matters even more.
Continuous reassessment updates third-party risk profiles as conditions change instead of waiting for a fixed review cycle. According to Ponemon Institute research [1], 78% of healthcare security leaders identify continuous reassessment as a critical automation goal, and only 21% of manual assessments lead to actionable remediation. That's where risk starts to pile up.
Repeat findings also drop when the workflow applies the same process every time. Standardized questionnaires - something 74% of organizations want but only 38% have achieved [1] - mean vendors answer the same standardized risk assessment questions, and reviewers score them against the same criteria. Less noise, fewer missed details, and a better chance of spotting the issues that matter sooner.
How Censinet Supports Scalable Healthcare Risk Operations
This matters most when teams can apply it across the full vendor lifecycle, not just in one isolated step.
Censinet supports healthcare risk operations at scale. Censinet RiskOps turns third-party vendor risk management into a continuous function instead of a periodic manual exercise. Censinet Connect streamlines vendor collaboration and cuts back-and-forth along with cycle time. Censinet One provides managed services for organizations that want structured support alongside the platform.
Censinet AI focuses on the steps that eat up the most analyst time. AI surfaces key evidence instead of forcing reviewers through page-by-page review. And instead of having a coordinator decide where each finding should go, routing logic handles that automatically.
That kind of scale sets up the next decision: which workflow should teams automate first, and how should they measure the payoff?
Building the Business Case for Automation: A Practical Framework
Use the cost-per-assessment and backlog math above to figure out where automation pays back first. The business case starts with baseline numbers and a clear sequence.
What to Automate First and How to Measure the Payoff
Using the cost-per-assessment and backlog math above, the next move is to focus on the workflow that gives back hours fastest. Start with the highest-volume, most standardized work. Intake and questionnaire distribution are the first targets because they happen often, follow a set pattern, and are easy to measure before and after automation.
Automating questionnaire distribution alone can cut administrative effort per assessment by 30%–50%. Standardized intake also cuts manual triage and misrouting. That matters because small time savings add up fast when the same task repeats across every vendor review.
A practical rollout over the next 6–12 months is to move next into scoring and routing, then into evidence collection and reporting once the basics are in place. In plain terms, don't try to automate everything at once. Get intake working first, then build from there.
| Workflow Stage | Automate in | Payoff |
|---|---|---|
| Intake & questionnaire distribution | Months 1–3 | Reclaimed analyst hours; consistent vendor intake |
| Scoring and routing | Months 3–6 | Standardized risk ratings; faster escalation |
| Evidence collection and reporting | Months 6–12 | Faster response completeness; quicker stakeholder reporting |
Before launch, capture six baseline metrics:
- average labor hours per assessment
- cycle time from intake to sign-off
- assessments completed per FTE per month
- onboarding delays caused by risk review
- backlog size
- the share of high-risk findings open beyond 90 days
These numbers anchor ROI. Without them, it's hard to show what changed.
Use this capacity-savings model: if analysts currently spend 15 hours per assessment and automation brings that down to 9 hours, that's 6 hours saved per vendor. At a fully loaded rate of $80/hour across 300 assessments per year, that equals $144,000 in annual labor savings. That's the kind of math leaders can act on.
Then pair that with cycle-time data. A 20-day reduction in assessment turnaround translates directly into faster vendor onboarding and remediation, plus shorter exposure windows. Said another way, the gain isn't just labor cost. It's also speed.
Measure those gains against the baseline numbers captured before launch. Track average hours per assessment, cycle time in days, and assessments completed per FTE per month at 3, 6, and 12 months. Use those checkpoints to compare baseline and post-automation performance at 3, 6, and 12 months.
FAQs
How do I calculate my own cost per assessment?
Start with a baseline: track the average time for one assessment, including onboarding, review, and follow-up. Then multiply that by the fully loaded hourly rate. For example, 4.0 hours at $75.00 per hour = $300.00 per assessment.
If you want a tighter number, divide total annual GRC labor costs by total annual assessment volume. That helps fold in the operational overhead tied to the work, not just the hours spent on each assessment.
When does automation start to pay for itself?
Automation usually pays for itself within 12 to 18 months. Most organizations see ROI through lower labor costs, smoother day-to-day operations, and less financial risk tied to data breaches and compliance penalties.
When healthcare teams move away from manual, spreadsheet-based workflows, they can get back thousands of staff hours each month. That time can then go toward higher-value work, like risk analysis and better strategic decisions, instead of getting stuck in admin tasks.
What should we automate first?
Start with high-volume, repeat tasks that eat up the most staff time. Put vendor questionnaires and evidence collection at the top of the list, since they’re often the biggest bottlenecks in an assessment process.
Take a phased approach. Begin with simpler workflows first, especially the ones slowed down by manual data entry, long email chains, and spreadsheet tracking. That helps free up time for higher-value risk analysis, while still keeping human oversight in place for critical decisions.
Related Blog Posts
- Third-Party Risk Management ROI Calculator: Prove Your Program's Value to Healthcare Executives
- The hidden tax of digital health: vendor risk is draining 20% of IT resources.
- Third-Party Risk Management ROI Calculator: Prove Your Program's Value to Healthcare Executives
- The Business Case for Healthcare TPRM: Cost Savings and Risk Reduction Statistics
